URD 2023
-
INTRODUCTION
Euronext N.V. (the “Company” or “Euronext” and together with its subsidiaries, the “Group”) is a Dutch public company with limited liability (naamloze vennootschap), whose ordinary shares are admitted to listing and trading on regulated markets in the Netherlands, France, Belgium and Portugal. The applicable regulations with respect to public information and protection of investors, as well as the commitments made by the Company to securities and market authorities, are described in this Universal Registration Document (the “Universal Registration Document”).
In addition to historical information, this Universal Registration Document includes forward-looking statements.
The forward-looking statements are generally identified by the use of forward-looking words, such as “anticipate”, “believe”, “estimate”, “expect”, “intend”, “plan”, “project”, “predict”, “target”, “will”, “should”, “may” or other variations of such terms, or by discussion of strategy. These statements relate to Euronext’s future prospects, developments and business strategies and are based on analyses or forecasts of future results and estimates of amounts not yet determinable. These forward-looking statements represent the view of Euronext only as of the dates they are made, and Euronext disclaims any obligation to update forward-looking statements, except as may be otherwise required by law. The forward-looking statements in this Universal Registration Document involve known and unknown risks, uncertainties and other factors that could cause Euronext’s actual future results, performance and achievements to differ materially from those forecasted or suggested herein. These include changes in general economic and business conditions, as well as the factors described in section 2.1 - Risk Factors of this Universal Registration Document.
This universal registration document has been filed with the Stichting Autoriteit Financiële Markten (the “AFM”) on 28 March 2024 as competent authority under Regulation (EU) 2017/1129 without prior approval pursuant to Article 9 of Regulation (EU) 2017/1129. This universal registration document may be used for the purposes of an offer to the public of securities or admission of securities to trading on a regulated market if approved by the AFM together with any amendments, if applicable, and a securities note and summary approved in accordance with Regulation (EU) 2017/1129.
This copy of the annual financial reporting of Euronext N.V. for the year ended 31 December 2023 is not presented in the ESEF-format as specified in the Regulatory Technical Standards on ESEF (Delegated Regulation (EU) 2019/815). The ESEF single reporting package is available at: https://www.euronext.com/en/investor-relations/financial-information/financial-reports

Stéphane Boujnah
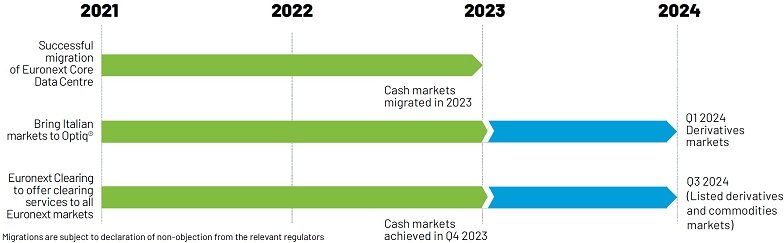
“The migration of Borsa Italiana’s derivatives to Optiq in Q1 2024 and the expansion of Euronext Clearing to Euronext listed derivatives by Q3 2024 will complete our presence on the entire trading value chain and will position Euronext ideally to capture future growth opportunities.
As we celebrate the 10 year anniversary of our IPO in 2024, I am looking forward to deep-dive into the opportunities that this transformation will offer for Euronext in the coming years at our Investors Day in November 2024.”

Dear Shareholders
In 2023, Euronext was able to demonstrate that it is more diversified and stronger than ever.
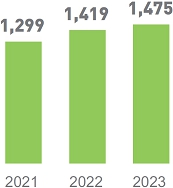
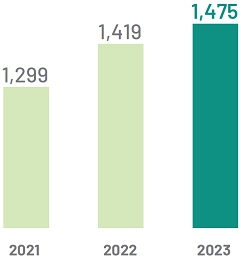
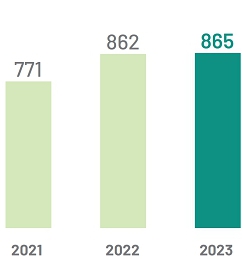
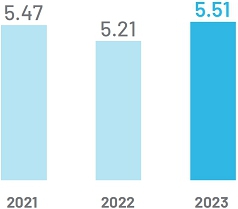
Euronext reached record revenue close to €1.5 billion in 2023, resulting from the strong performance of our non-volume related activities and excellent performance of our fixed income and power trading franchises. Thanks to our trademark cost discipline, positive FX impacts and a one-off accruals release, we reported lower costs than our 2023 cost guidance. As a result, we achieved an adjusted EBITDA of €864.7 million, which translated into an adjusted EPS of €5.51. Consequently, we will propose a total dividend of €256.8 million at our next annual general meeting to be held in May 2024.
Importantly, in 2023, we were able to demonstrate once again our exceptional integration capabilities. We delivered some of the key milestones of our ‘Growth for Impact 2024’ strategic plan. With the successful migration of Borsa Italiana’s cash markets to Optiq®, Euronext was able to reinforce its leadership in cash equity trading across Europe. We are today uniting 25% of European equity trading on Euronext’s single technology platform, forming the largest liquidity pool in Europe.
In November 2023, we established Euronext Clearing as the CCP of choice for Euronext’s cash markets, with the expansion of its offering to Belgium, France, Ireland, the Netherlands and Portugal. We also set MTS as a recognized interdealer platform for the implementation of electronic market making on European Union issued debt instruments, with very dynamic first volumes. These projects have contributed to the €74 million of run-rate cumulated EBITDA synergies delivered by end of 2023, above the €70 million 2023 intermediary target. This is already more than the €60 million of run-rate cumulated EBITDA synergies targeted for the end of 2024 we initially announced in April 2021, at the time of the completion of the Borsa Italiana Group acquisition.
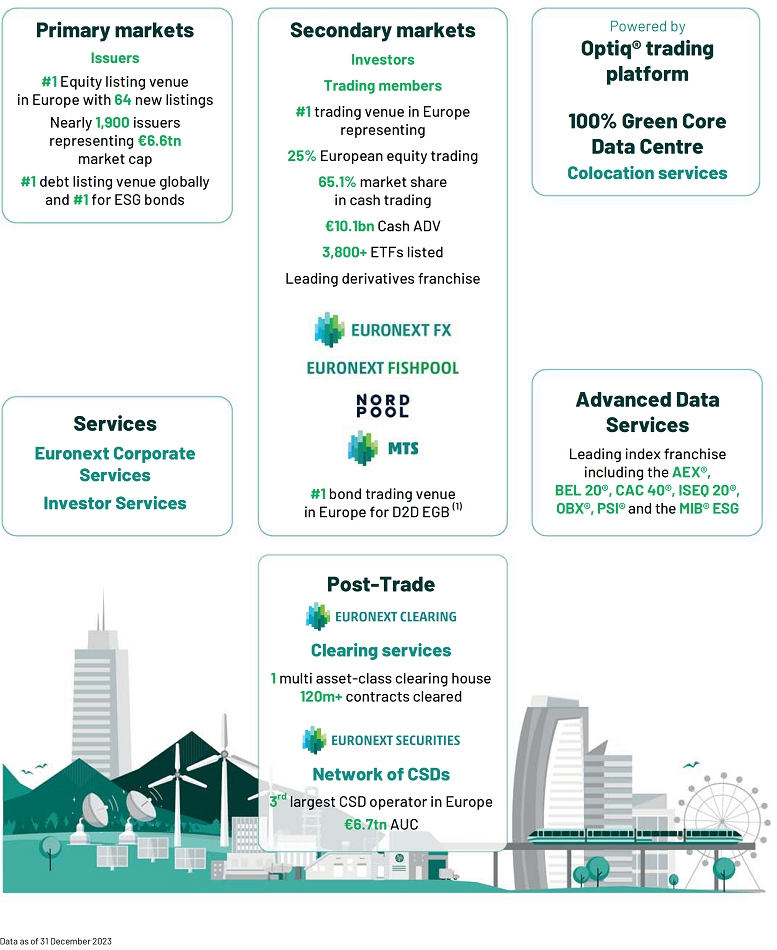
Throughout the year, we continued to consolidate our leadership position in the listing of equities in Europe, welcoming 64 new companies on our market, and attracting the majority of international listings in Europe. In addition, we continued to support the financing of the real economy through capital markets, with more than 300 issuers that raised €20 billion on Euronext through follow-on transactions to fund their growth and investment projects. We consolidated our position as the first debt listing venue worldwide, with more than 55,000 total bonds listed on our market. Euronext has also further solidified its position as the world leading venue for sustainable bonds, with more than 450 new ESG bond listings in 2023 raising more than €280 billion.
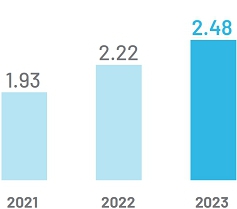
In July 2023, we disposed our 11.1% stake in LCH SA. Together with our strong cash generation capabilities, this enabled us to perform a €200 million share buy-back programme over the second half of the year. This programme did not impact our deleveraging path. At the end of 2023, our net debt to adjusted EBITDA ratio reached 1.9x. This compares to 3.2x post acquisition of the Borsa Italiana Group in 2021.
In 2024, we will bring the Italian derivatives markets to our single trading platform, Optiq®. Euronext Clearing will become the clearing house for listed derivatives and commodities markets in Q3 2024. This strategic transformation will result in Euronext’s presence across the entire trading value chain on the markets it operates, ideally positioned to capture future growth opportunities. We are well on track to deliver on our upgraded target of €115 million of cumulated run-rate EBITDA synergies by the end of 2024, as well as our medium-term revenue and EBITDA growth targets for 2024 set in the ‘Growth for Impact 2024’ strategic plan.
2024 marks the 10 years anniversary of Euronext since its IPO, and allows us to observe the exceptional growth transformation the group has undergone during the last 10 years. We have expanded across the entire trading value chain, and have extended the range of products we provide to our clients, such as power trading, forex or fixed income. The delivery of the last bricks of our strategic plan will unlock new innovation capabilities for us, which we will further detail with the release of our new strategic plan for 2027 on our investor day in November 2024.
Stéphane Boujnah
€74m
RUN-RATE
SYNERGIES
DELIVEREDSynergies achieved above the interim target of €70 million by end of 2023
Successful migration of Italian cash markets to Optiq®
Successful expansion of Euronext Clearing as pan-European clearing house for cash markets
€103 million of cumulated implementation costs incurred at the end of 2023
The migration of Italian derivatives markets to Optiq in Q1 2024 and the expansion of Euronext Clearing to Euronext listed derivatives by Q3 2024 will significantly contribute to reaching the targeted €115 million run-rate annual EBITDA synergies by end of 2024.
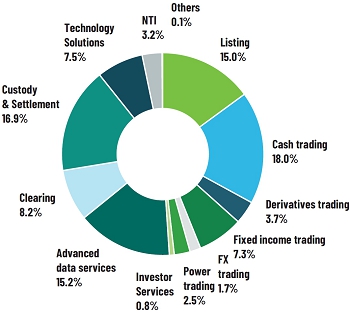
A more diversified revenue base with non-volume related revenue accounting for 60% of total revenue and income of €1,475 m
Underlying revenue and income as well as Adjusted EBITDA are defined in section 5.2 - Other Financial Information
(c) Non-volume related revenue include Advanced Data Services, Custody and Settlement, Technology Solutions, Listing exc. IPO fees, Investors Services, fixed fees arising from Clearing activities and NTI through CCP activities
OUR AMBITION OUR PURPOSE OUR MISSION Build the leading market infrastructure in Europe Shape capital markets for future generations Connect European economies to global capital markets, to accelerate innovation and sustainable growth “IN 2024, EURONEXT WILL CONTINUE ITS COSTS CONTROL POLICY AND EXPECTS THAT SAVINGS AND SYNERGIES WILL OFFSET INFLATION AND 2023 COSTS RAMP-UP. AS A RESULT, EURONEXT EXPECTS ITS 2024 UNDERLYING EXPENSES EXCLUDING D&A TO BE AROUND €625 MILLION, INCLUDING AROUND €10 MILLION TO FINANCE GROWTH PROJECTS AND EXCLUDING POTENTIAL IMPACT FROM FX OVER THE YEAR.”
 Financial
targets solely based on organic growth, excluding any new M&A contributions and driven by higher growth expected in non-volume
related activities Expected
uplift in profitability from the integration of the Borsa Italians Group combined with continued best-in-class cost discipline Including
€115 million of run-rate pre-tax synergies from the integration of the Borsa Italiana Group (2) and €150 million of non-recurring implementation costs (3). Acquisitions
expected to contribute to higher organic revenue growth, provide scalability and/or improve exposure to non-volume
related businesses
Financial
targets solely based on organic growth, excluding any new M&A contributions and driven by higher growth expected in non-volume
related activities Expected
uplift in profitability from the integration of the Borsa Italians Group combined with continued best-in-class cost discipline Including
€115 million of run-rate pre-tax synergies from the integration of the Borsa Italiana Group (2) and €150 million of non-recurring implementation costs (3). Acquisitions
expected to contribute to higher organic revenue growth, provide scalability and/or improve exposure to non-volume
related businessesTake recent successes to the next level Continue to review transformational deals Corporate
Services Post-trade
solutions Investor
Services Strengthen
the pan-European infrastructure model Diversify
the revenue mix[1] Pro forma for the acquisition of the Borsa Italiana Group, excluding transitional revenue and cost.
[3] Upgraded implementation costs announced in May 2022 [-€10 million compared to implementation costs announced in November 2021].
1 FOR EURONEXT: Commit to the alignment of our own emissions with a 1.5-degree trajectory, the most demanding climate ambition, under the Science-Based Targets initiative.
Emission reduction targets validated by SBTI Progress achieved in 2023 Operational emission reduction target
• 73.5% reduction of Euronext’s Scope 1 and Scope 2 market-based greenhouse gas emissions by 2030 compared to 2020
• At least 46.2% reduction of Euronext’s Scope 3 travel emissions by 2030 compared to 2019

• Combined Scope 1 and Scope 2 (market-based) emissions decreased by 79% compared to 2020, primarily attributed to the adoption of green electricity and renewable energy sources
• Scope 3 travel emissions decreased by 37.6% compared to 2019, signaling progress despite gradual travel resumption
• 32% of suppliers, representing over 72% of emissions from purchased goods and services, established SBTi targets by December 2023
Supplier engagement target
• By 2027, Euronext suppliers, representing 72% of Euronext’s greenhouse gas emissions derived from purchased goods and services, must set targets on their Scope 1 and Scope 2 emissions
Action plan per target Scope 1 
Consolidation and energy efficiency upgrades in the building portfolio, energy efficiency investments, de-commissioning of gas-fired boilers and de-commissioning of vehicle fleet Scope 2 Moving office space and data centres to renewable energy, including through the move of Euronext’s Core Data Centre Scope 3 Implementation of sustainable travel programme Supplier engagement Actively establishing and executing a supplier engagement program aimed at achieving our SBTi supplier engagement target. The initiative includes the implementation of supplier incentives, a specialized training program, and effective communication strategies 2
FOR OUR CLIENTS: Deploy a full suite of climate-focused products and services, facilitating the European trajectory towards sustainable growth.Launched +440 ESG indices Leading venue for ESG bonds My ESG Profile • Euronext Biodiversity Enablers index, 1st world benchmark index on biodiversity
• ESG versions of its benchmark indices, including the CAC® 40 ESG, MIB ESG, AEX® ESG, BEL® ESG, and OBX® ESG, CAC SBT 1.5
• N°1 worldwide listing venue for ESG bonds in 2023, with almost 500 new bond listings
• N°1 global venue for ESG bond issuers and amount raised, with +2,200 ESG bonds, from +500 issuers, accounting for +1.3tn€
• 1st stock exchange to make standardized ESG data of its issuers available
• +1,900 company ESG profiles containing +60,000 data points on Euronext Live
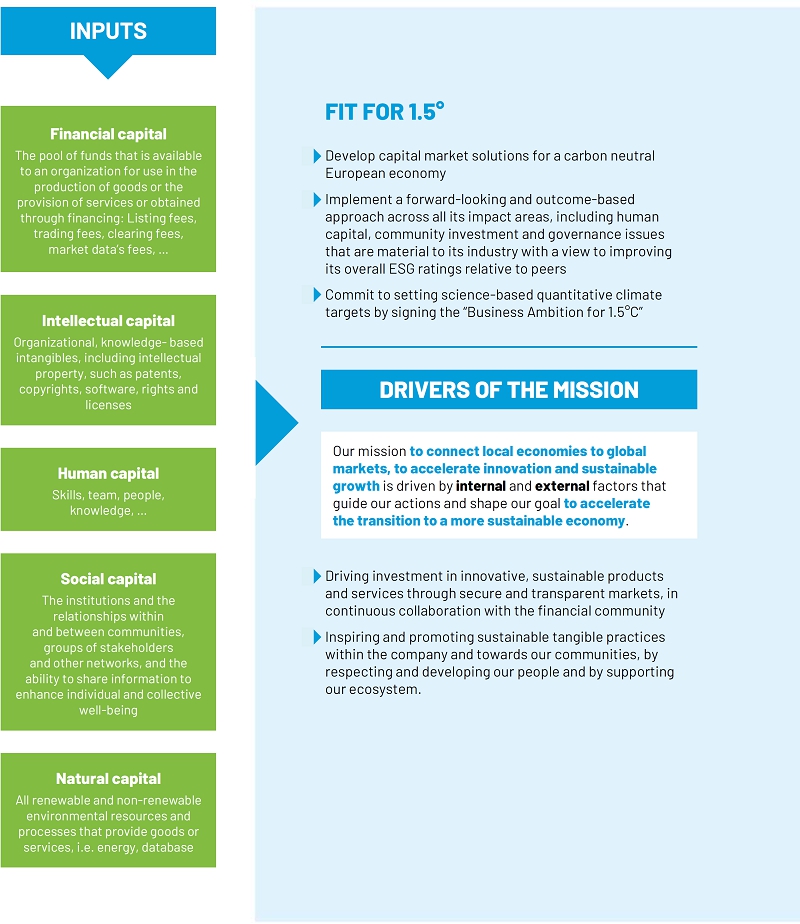
Driving investment in innovative, sustainable products and services
through secure and transparent markets, in continuous dialogue between the players of the financial community
Inspiring and promoting sustainable tangible practices
within the company and towards our communities, by respecting and developing our people and by supporting our ecosystem
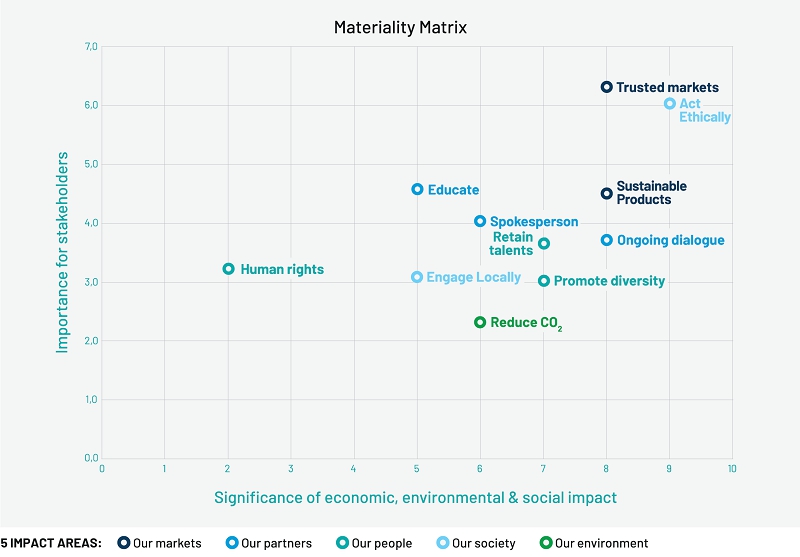
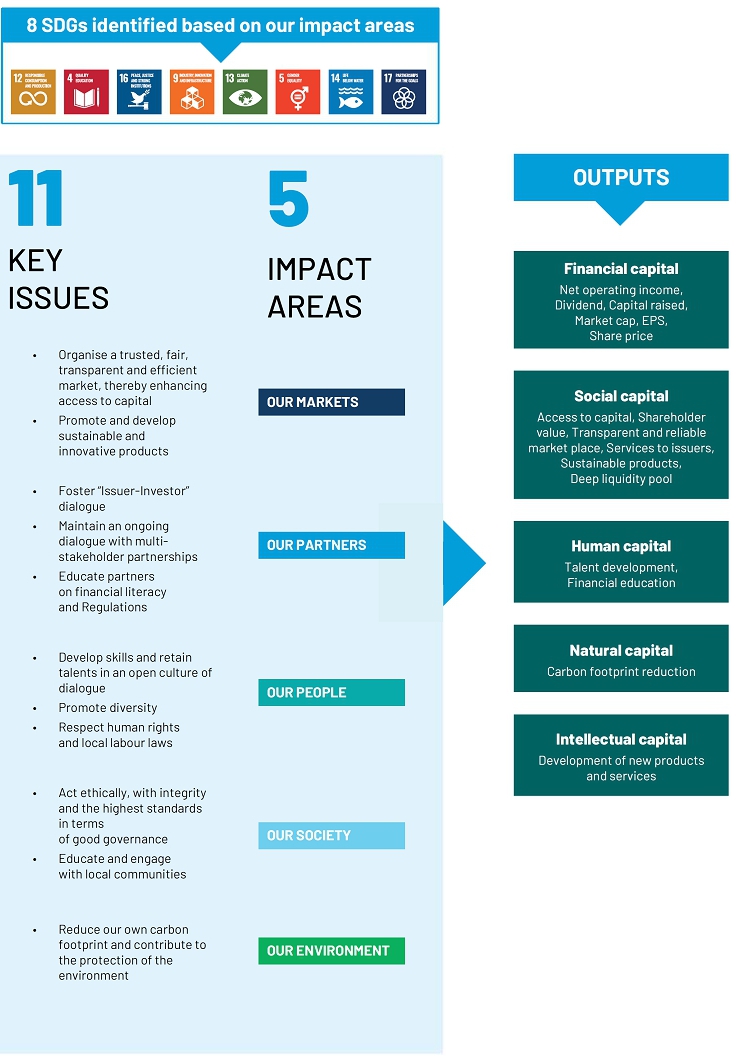
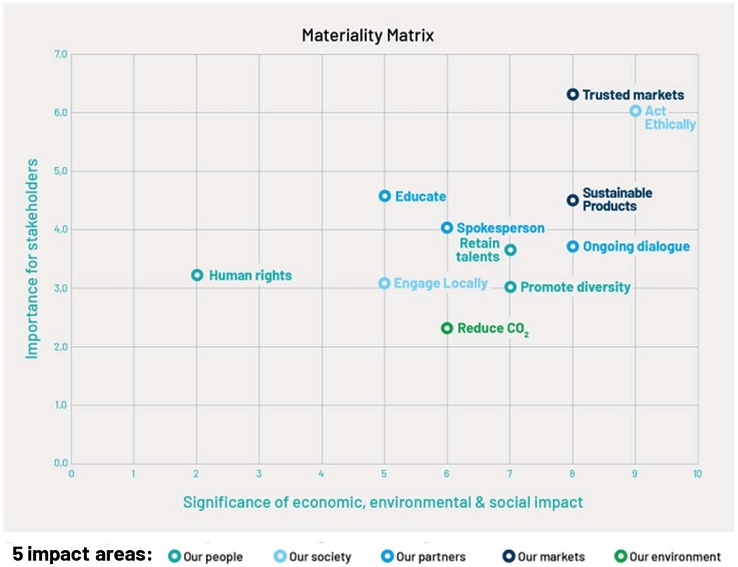
Euronext conducted a stakeholder consultation in 2018 and 2019 to identify its material ESG issues. Based on the results, eleven key issues were defined and grouped into five material impact areas, ranking them in terms of their importance to stakeholders and the ESG impact they could have. These are illustrated in the below materiality matrix.
Additionally, in 2023, Euronext launched a new stakeholder engagement initiative to conduct a double materiality assessment in accordance with the European Corporate Sustainability Reporting Directive (further information in section 3.1).

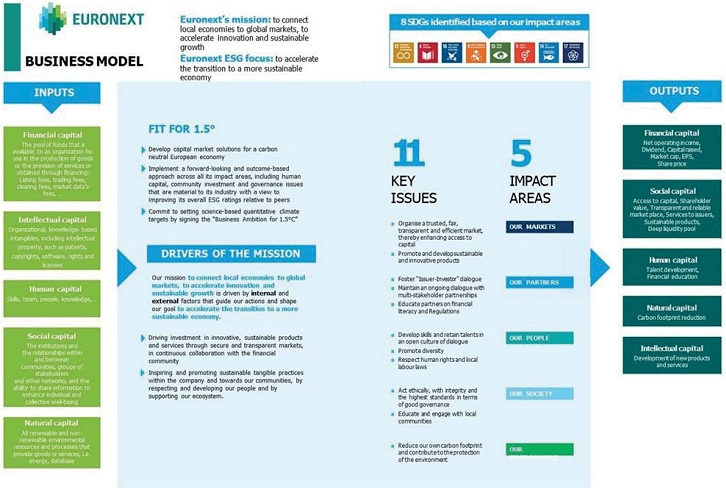
BUSINESS MODEL
Euronext’s mission: to connect local economies to global markets, to accelerate innovation and sustainable growth
Euronext ESG focus: to accelerate the transition to a more sustainable economy
Committees of the Supervisory Board Independent Audit Risk Remuneration Nomination
& GovernancePiero Novelli
Chair58 


● Chair Dick Sluimers
Vice-Chair70 
Chair ● Nathalie Rachou 66 

Chair ● Morten Thorsrud 52 
● Chair Rika Coppens 51 
● ● Manuel Ferreira Da Silva 66 
● ● Padraic O’Connor 74 
● ● Alessandra Ferone 53 ● ● Olivier Sichel 56 Diana Chan 69 
● ● ● ● Name Position 
Stéphane Boujnah 59 CEO and Chairman of the Managing Board 
Delphine D’Amarzit 50 CEO Euronext Paris 
Fabrizio Testa 55 CEO Board Italiana and Head of Fixed Income Trading 
Simone Huis In’t Veld 53 CEO Euronext Amsterdam 
Simon Gallagher
Appointment subject to shareholders approval in May 202450 
CEO Euronext London and Head of Global Sales 
Øivind Amundsen 56 CEO Oslo Børs 
Isabel Ucha 58 CEO Euronext Lisbon 
Daryl Byrne 52 CEO Euronext Dublin 
Benoît van den Hove 48 CEO Euronext Brussels 
Manuel Bento 49 COO Senior management Role Senior management Role Giorgio Modica 50 Group CFO Angelo Proni 57 CEO of MTS Sylvia Andriessen 58 General Counsel Mathieu Caron 45 Head of Primary Markets Camille Beudin 39 Head of Diversified Services Aurélie Cohen 36 Chief Communications and Investor Relations Officer Amaury Houdart 48 Chief Talent Officer Pierre Davoust 37 Head of CSDs Tatyana Valkova 40 
Head of Compliance and Risks Daniela Melato 47 Head of Group Data Services Anthony Attia 49 Global Head of Derivatives and Post-Trade Nicolas Rivard 46 Global Head of Cash Equity and Data Services (b) Treasury shares include shares acquired as part of the share repurchase programme, carried between 31 July 2023 and 4 January 2024, which will be cancelled
Name of reference shareholder Number of
sharesIndividual
shareholding
(% of capital)Caisse des Dépôts et Consignations 7,840,000 7.32% CDP Equity 7,840,000 7.32% Euroclear S.A./N.V. 4,284,252 4.00% Société Fédérale de Participations et d’Investissement/ Federale Participate- en Investeringsmaatschappij 3,391,200 3.17% Intesa SanPaolo 1,606,594 1.50% ABN AMRO Bank N.V. through its subsidiary ABN AMRO Participaties Fund I B.V. 539,000 0.50% TOTAL SHAREHOLDING (a) 25,501,046 23.81% On 8 March 2024, an announcement was published confirming that Société Fédérale de Participations et d’Investissement, Caisse des Dépôts et Consignations and CDP Equity agreed with Euroclear S.A./N.V. to acquire from Euroclear respectively 2,142,126, 535,531 and 535,531 shares in the share capital of Euronext N.V., representing respectively 2.0%, 0.5% and 0.5% of the share capital of the Company.
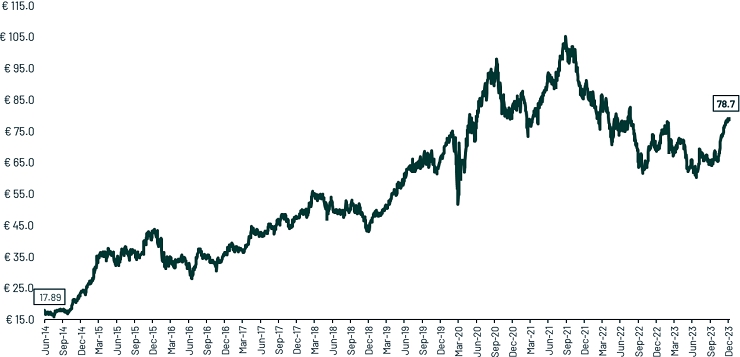
Euronext shares are listed on Euronext Amsterdam, Euronext Brussels, Euronext Lisbon and Euronext Paris since June 2014.
- Postal Address: Beursplein 5, NL-1012 JW Amsterdam, Netherlands
- Phone: +31 (0)20 72 14 400
- https://www.euronext.com
- Website: https://www.euronext.com/en/investor-relations
- Email: ir@euronext.com
- Postal Address: 14 place des Reflets, 92054 Paris La Défense Cedex, France
- Phone: +33 (0)1 70 48 24 17
Euronext is part of more than 140 indices, including the CAC Next 20, SBF 120, MSCI Standard Series, Stoxx 600 Financial Services, Euronext Equileap Gender Equality France 40 and CAC SBT 1.5
-
1. PRESENTATION OF THE GROUP |DR|
1.1 Company Profile
Euronext N.V. is a Dutch public company with limited liability (naamloze vennootschap) with its registered office in Amsterdam. the Netherlands, Euronext N.V. is registered with the trade register of the Chamber of Commerce for Amsterdam, the Netherlands, under number 60234520. Euronext N.V. has its main subsidiaries in Belgium, Denmark, France, Ireland, the Netherlands, Norway, Portugal, Italy, the United Kingdom and the United States. Euronext N.V. has diversified its activities and services offering through selected acquisitions (please refer to section 1.1.1 - History) and expanded its European federal model, with the acquisition of 100% of the Irish Stock Exchange on 27 March 2018, 100% of Oslo Børs VPS on 4 July 2019, 100% of VP Securities, in Copenhagen, on 4 August 2020 and 100% of London Stock Exchange Group Holdings Italia S.p.A. (renamed Euronext Holding Italia S.p.A. after the acquisition) and its subsidiaries (Borsa Italiana Group) on 29 April 2021.
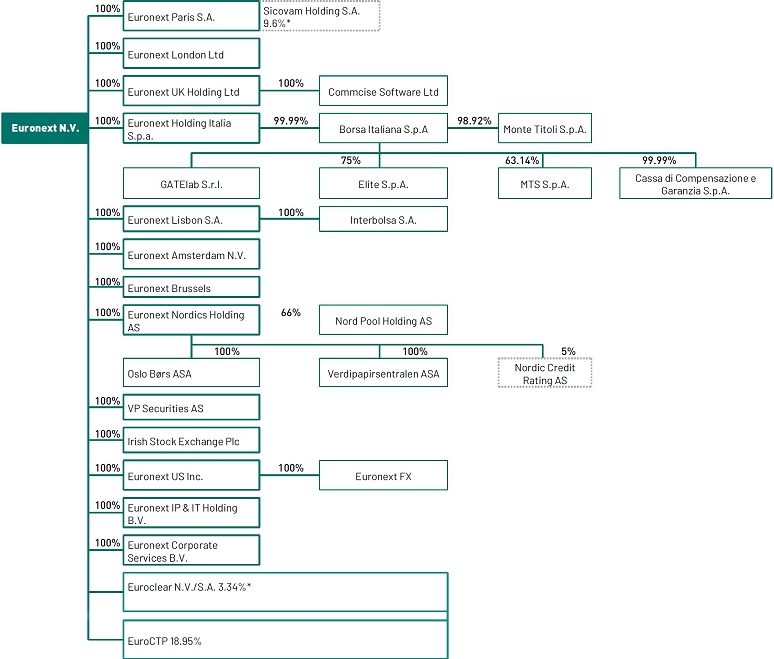
Euronext was incorporated under the name Euronext Group N.V. on 15 March 2014 in the context of a demerger of Euronext N.V., which was a company owned by ICE. Euronext Group N.V. changed its name to Euronext N.V. on 2 May 2014. The following chart provides an overview of Euronext N.V. main entities as of 31 December 2023. Percentages refer to both share of capital and voting rights.
1.1.1 HISTORY
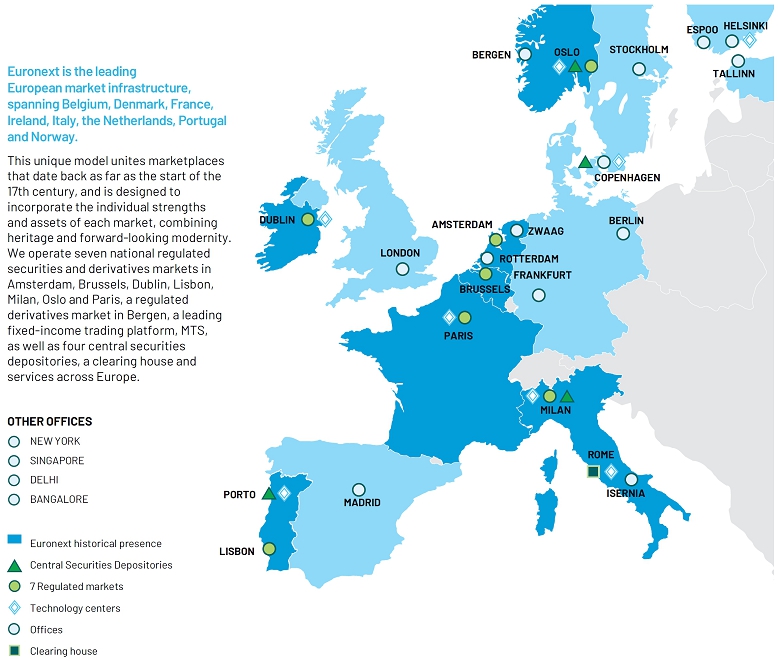
Today, Euronext is the leading pan-European market infrastructure, offering a diverse range of products and services across the value chain and notably operating transparent and efficient equity, fixed income securities and derivatives markets in Amsterdam, Brussels, Dublin (since March 2018), Lisbon, Milan (since April 2021), Oslo (since June 2019) and Paris. Euronext’s businesses comprise equity, debt, fund and ETF listing, corporate and investor services, cash trading, foreign exchange trading, derivatives trading, fixed income trading, power trading, advanced data services and post-trade services (including clearing across Euronext markets and custody and settlement in Denmark, Italy, Norway and Portugal) as well as technology solutions. As of the end of December 2023, Euronext has close to 1,930 listed equity issuers totalling around €6.6 trillion in combined market capitalisation, positioning it as the largest equity listing venue in Europe, and attracting the majority of listings from domestic and international companies in Europe. The Group is also the leading bond and ESG bond listing venue globally with over 55,000 bonds listed. Further, Euronext is the largest equity lit trading venue in Europe, processing over 25% of on-exchange lit trading flows in 2023. On the seven national markets it operates, the Group reported on average a 65.1% market share on cash equity lit trading. Euronext is about to be present on the full trading value chain, ranging from listing to custody and settlement, following the clearing migration in 2023 and its second phase planned for 2024.
Euronext in its original form was created in 2000 and takes its roots from the European construction. It began as the result of a three-way merger of the Paris, Amsterdam and Brussels exchanges, which were combined into a unique federal model with unified rules and a Single Order Book, operating on the same electronic trading platform and cleared by LCH S.A. central counterparty (CCP). This created the first genuinely cross-border exchange in Europe, pre-dating all initiatives by policy makers to allow for the creation of pan-European market places. This was complemented soon after by the acquisition of the London-based derivatives market, LIFFE, and the merger with the Portuguese exchange.
In May 2006, Euronext entered into an agreement with NYSE group for the combination of their respective businesses. The new holding company of these combined businesses, NYSE Euronext, was subsequently listed on the New York Stock Exchange and on Euronext Paris.
In 2010, NYSE Euronext launched Euronext London, a London-based securities market aiming at attracting international issuers looking to list in London and benefit from Euronext’s value proposition1.
In November 2013, ICE, an operator of global markets and clearing houses, acquired NYSE Euronext. A key element of the overall transaction was the separation and IPO of NYSE Euronext’s continental European exchanges as a stand-alone entity. In order to do this, ICE carved out the continental European operations of NYSE Euronext and Euronext London into a newly formed entity, which was subsequently renamed Euronext N.V. Since its successful IPO on 20 June 2014, Euronext N.V. has been an independent listed company.
In May 2016, Euronext N.V. launched its strategic plan named “Agility for Growth” which defined its growth ambitions for 2019, both through organic growth and bolt-on acquisitions. In 2017, Euronext N.V. diversified its revenue, through the acquisition of 90% of the shares of the spot forex platform FastMatch (subsequently renamed Euronext FX), and by investing in corporate services companies.
In 2018, Euronext N.V. expanded its listing franchise, welcoming a new exchange to its federal model with the acquisition of the Irish Stock Exchange, now Euronext Dublin. The Group also strengthened its Corporate Services offering with the acquisition of InsiderLog and widened its product offering with the launch of Investor Services through the acquisition of Commcise in December 2018.
In 2019, Euronext N.V. pursued the expansion of its federal model with the acquisition of Oslo Børs VPS, strengthening its capital markets footprint and its post-trade franchise and marking the first step in its Nordic expansion ambitions. In October 2019, Euronext launched its strategic plan, “Let’s Grow Together 2022” under which Euronext built the leading pan-European market infrastructure, and which targets have been achieved two years in advance.
In 2020, Euronext N.V. pursued both its Nordic and federal model expansion. The Group acquired a majority stake in Nord Pool, a leading power trading infrastructure operating in the Nordic region, Baltics and the Central and Western Europe region, widening its range of asset classes. The Group also strengthened its post-trade offering with the acquisition of VP Securities, now Euronext Securities Copenhagen, the Danish domestic CSD, and expanded its corporate services franchise with the acquisition of Troisième Sens and Ticker.
In 2021, Euronext N.V. pursued both its federal model and asset class expansion with the transformational acquisition of 100% of the issued share capital of London Stock Exchange Group Holdings Italia S.p.A., the holding company of the Borsa Italiana Group. The transaction, which was completed on 29 April 2021, significantly enhances the scale of Euronext, diversifies its business mix into new asset classes and strengthens its post-trade activities, especially in clearing. In November 2021, Euronext N.V. launched its new strategic plan “Growth for Impact 2024”, which sets out the Group’s ambition to build the leading market infrastructure in Europe. Under this plan, Euronext N.V. will continue to pursue its mission to connect European economies to global capital markets, to accelerate innovation and sustainable growth. The Group aims to make an impact on its industry and its ecosystem to shape capital markets for future generations.
In 2023, Euronext N.V. delivered on significant milestones of its “Growth for Impact 2024” strategic plan. Euronext successfully completed the migration of the cash markets of Borsa Italiana to Euronext’s state-of-the-art trading platform Optiq®. This paved the way for the expansion of Euronext Clearing to Euronext Amsterdam, Brussels, Dublin, Paris, and Lisbon cash markets. These two major projects contributed to the €74 million synergies delivered as of end of 2023.
The Borsa Italiana Group integration programme is well advanced and has allowed Euronext to upgrade its 2024 cumulated run-rate annual EBITDA synergy target since the closing of the Borsa Italiana acquisition in April 2021 to €115 million, representing twice the amount announced in October 2020, when the acquisition was first announced (€60 million).
-
1.2 Strategy: “Growth for Impact 2024” Strategic Plan
1.2.1 “GROWTH FOR IMPACT 2024”, A PATH TO BUILD THE LEADING MARKET INFRASTRUCTURE IN EUROPE
Since its initial public offering (IPO) in 2014, through optimal resource allocation and cost control, as well as stronger development of underexploited businesses, Euronext has strived to deliver its solutions for the real economy.
Following the delivery of its IPO objectives a year in advance, in May 2016 Euronext published its strategic plan, “Agility for Growth”, outlining its growth ambitions to 2019. Euronext achieved most of its “Agility for Growth” ambitions one year in advance, and announced in October 2019 its next strategic plan, “Let’s grow together 2022”, introducing its growth ambition to 2022. Under this plan, Euronext has successfully delivered its ambition to become the leading pan-European market infrastructure, through a combination of organic growth, the acquisitions of Nord Pool1 and VP Securities (Euronext Securities Copenhagen), and the transformational acquisition of the Borsa Italiana Group. Euronext achieved its 2022 financial targets two years in advance in 2020, thanks to strong organic revenue growth.
Euronext now operates seven national markets, four central securities depositories (CSDs) and one multi-asset clearing house in Europe, as well as various trading infrastructures, giving it the ability to manage the entire capital markets value chain for the first time since its IPO. Euronext can now more than ever be bold and strategically ambitious, leveraging its strengths and greater scale to deliver on its new ambition: build the leading market infrastructure in Europe.
In November 2021, Euronext released its three-year strategic plan, “Growth for Impact 2024”. Under this plan, Euronext intends to grow and leverage its scale for the benefit of its clients, team members, shareholders and stakeholders. Euronext’s mission is to connect European economies to global capital markets, to accelerate innovation and sustainable growth.
“Growth for Impact 2024” sets out the Group’s ambition to build the leading market infrastructure in Europe. The Group aims to make an impact on its industry and its ecosystem fulfilling its purpose to shape capital markets for future generations.
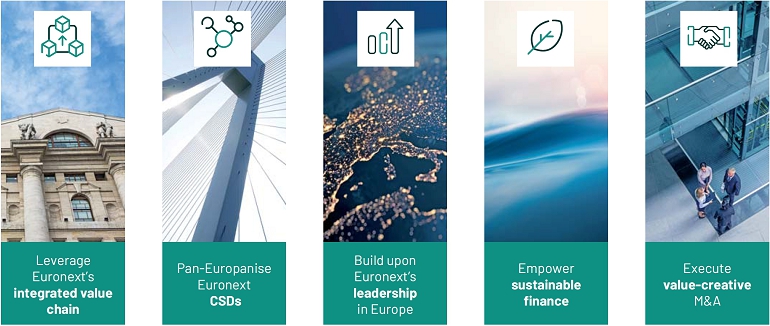
■ Leverage Euronext’s integrated value chain, through the European expansion of CC&G (renamed Euronext Clearing) clearing activities, the Core Data Centre migration to the European Union, and the international expansion of MTS; ■ Pan-Europeanise Euronext CSDs through the expansion of services across its four CSDs in Portugal, Norway, Denmark and Italy, the harmonisation of processes and enhancement of the client experience; ■ Build upon Euronext’s leadership in Europe, to further develop its leading listing and trading venues, to accelerate the delivery of innovative products and services thanks to technology, and to scale up advanced data services, corporate and investor services; ■ Empower sustainable finance through an ambitious climate commitment for Euronext that aims to make a tangible impact on its partners and clients, with the launch of the Fit for 1.5° climate commitment, and also through an enhanced inclusive people strategy; and ■ Execute value-creative M&A by continuing to seek external diversification opportunities, in line with Euronext’s strict investment criteria and its commitment to maintain an investment grade rating. Euronext was, until 2021, the only market infrastructure that did not directly manage its clearing activities for its listed derivatives markets. Since 2003, Euronext has relied on a third-party clearing house, LCH S.A., for the clearing of most of its cash and derivatives trading flows on its markets, with a revenue sharing agreement. Euronext has proposed on various occasions to take control of LCH S.A., unsuccessfully. Today, for the first time, thanks to the acquisition of Euronext Clearing in April 2021, Euronext is the owner of a multi-asset clearing house and is thus in a position to directly manage its clearing activities to complete its value chain. Euronext is determined to directly manage the clearing of its cash and derivatives flows. Therefore, it decided to expand Euronext Clearing clearing activities across Europe3.
Euronext is making Euronext Clearing Euronext’s central counterparty (CCP) of choice for its cash equity, listed derivatives and commodities markets in Europe. Euronext continues to offer an open access CCP model for cash equity clearing.
Euronext is positioning Euronext Clearing as a European clearing house. Euronext Clearing was enhanced with a new Value at Risk framework. Euronext Clearing will be reinforced by cutting-edge technology in line with its new international ambitions. The European clearing organisation has teams in Italy and France.
This strategic ambition allows Euronext to directly manage another core service for clients and create value through a harmonised clearing framework across Euronext venues. It will allow Euronext to align strategic priorities between trading and clearing, and significantly increase its footprint in the post-trade space. In addition, Euronext will be in an ideal position to innovate and improve time-to-market, notably on derivatives products, to serve the evolving needs of its clients. Revenue and costs contribution for this key project are part of the increased Borsa Italiana Group synergies target. Similarly, the necessary one-off costs to execute this project are included in the 2024 guidance4.
In January 2023, Euronext sent notice of termination to LCH S.A. for its derivatives clearing agreements and confirmed the expansion of Euronext Clearing to listed derivatives and commodities markets for the third quarter of 2024. In November 2023, Euronext Clearing was expanded as the CCP of choice for Euronext cash markets in Amsterdam, Brussels, Dublin, Lisbon and Paris.
Euronext announced in April 2021 the strategic decision to migrate its Core Data Centre from Basildon, in the United Kingdom, to Bergamo, in Italy.
The migration is a response to multiple factors, including the dynamic created by Brexit and a strong rationale to locate the Group’s Core Data Centre in a European Union country where Euronext operates a large business. This transformative move, managed in collaboration with clients, marks a milestone in bringing back to the European continent the data centre that handles 25% of European trading volumes.
This migration allows Euronext to fully control and directly manage its core IT infrastructure, and a key service to clients, which was previously outsourced. This also allows the generation of colocation revenues, embedded in the upgraded synergies. Clients are benefitting from a state-of-the-art colocation facility. Since this data centre is 100% powered by renewable energy sources, clients see their own carbon footprints reduced.
The Group Core Data Centre migration was completed in June 2022. This migration was timed to be ready for the migration of the Borsa Italiana equity and derivatives markets onto the Optiq® trading platform in 2023 and 2024.
Borsa Italiana joined the Euronext central order book, which offers a unique gateway to investors accessing the largest liquidity pool in Europe. This single liquidity pool is powered by Optiq®, Euronext’s proprietary state-of-the-art technology, offering a unique entry point to Euronext’s securities and products for both local and global institutional investors and for retail investors. Issuers are benefiting from this increased visibility towards international investors, while Italian brokers and investors will benefit from a single access point to trade the securities of seven European countries.
Borsa Italiana cash markets migrated to the Optiq® trading platform in 2023, and the migration of derivatives is targeted for Q1 2024.
2 Subject to regulatory approvals
3 Subject to regulatory approvals
4 To highlight its underlying performance, since Q1 2022 Euronext is adjusting its operating expenses and publishes an adjusted EBITDA excluding non-recurring item’s such as implementation costs for the strategic projects announced. For more information on the guidance see 1.2.3 - Strategic Targets and Prospects in 2023.
MTS is the leading fixed income trading platform in Europe, number one in Europe for Dealer-to-Dealer (D2D) European Government bonds trading, number one in Italian repo trading and number three in Europe for Dealer-to-Client (D2C) European Government bonds trading. As part of its mission to finance the real economy, Euronext has proposed to the European Commission the use of the MTS platform for the secondary market, and transparent negotiation, of bonds issued within the NextGenerationEU recovery programme.
Euronext will strengthen its leading position in D2D, through extended geographical reach and an expanded offering with new services. Its buy-side reach will be expanded through MTS BondVision together with the deployment of an added-value data offering. MTS will expand across the full value chain, by exploring opportunities to deploy new and existing solutions to meet the needs of its clients.
The European Union has recognised MTS EU as an interdealer platform for the implementation of electronic market making on European Union issued debt instruments. This new market was launched very successfully in November 2023.
The incremental revenue from MTS’s expansion strategy is included in the €115 million Borsa Italiana Group targeted synergies.
II. Pan-Europeanise CSDs through the expansion of services, the harmonisation of processes and enhancement of the client experience
Euronext operates a leading CSD network representing €6.7 trillion in assets under custody, 120 million yearly settlement instructions and more than 7,700 issuers5. The Group is now the third-largest CSD operator in Europe. Euronext has combined its four CSD brands into Euronext Securities, a new umbrella brand for its CSD business, while keeping a strong local presence and identity.
This new positioning will help Euronext gain new business and diversify its activity in Europe through the expansion of added-value services for financial institutions such as tax reporting services, compliance, data products and asset servicing. Euronext will also make new services available to issuers, especially SMEs, leveraging its fully digital issuance capabilities.
Euronext Securities will also streamline processes to better serve local and international customers, gradually mutualising its infrastructure, applications, and functionalities to facilitate access to the local markets served by Euronext Securities and to support Euronext issuance and trading businesses across Europe.
Finally, Euronext will roll out new targeted client interfaces and a client service model addressing the needs of both local and global clients.
Euronext is the leading equity listing venue in Europe with close to 1,930 issuers representing €6.6 trillion of aggregated market capitalisation6. Euronext is also the world’s leader in debt listing with more than 55,000 listed securities7.
Euronext’s size makes it by far the largest liquidity pool in Europe, providing an integrated “one-stop-shop” for local and global issuers, to cover their equity and debt financing needs, and corporate services.
Building on its geographic expansion, with the recent additions of the Irish, Norwegian and Italian markets, Euronext will continue to expand its pan-European reach and will welcome top international issuers, leveraging its unique liquidity pool and sectorial strengths.
With close to 1,500 SMEs listed on Euronext markets, the Group is committed to financing the real economy and will further simplify access to equity and bond financing by increasing the competitiveness of its listing venues. Euronext will expand Borsa Italiana’s STAR segment and grow the ELITE network to deepen its relationships with SMEs. Euronext’s successful pre-IPO programmes will be strengthened, notably with specific ESG modules to support issuers in their ESG transition and to comply with non-financial disclosure requirements. Euronext is Europe’s leading venue for Technology companies, with over 700 issuers listed on its markets across clean technologies, life sciences, technology, media and telecom (TMT), bio-technologies, medical technologies, and other sectors. Euronext will continue to grow this franchise, notably by continuing to invest in dedicated pre-IPO programmes, such as IPOready, which now counts over 920 alumni and more than 80 partners. Euronext has launched in June 2022 Euronext Tech Leaders initiative, including a segment and index dedicated to highlighting the visibility and attractiveness of high-growth listed Tech companies among international investors, together with a suite of services to support them through their financial journey. Alongside this segment, Euronext plans to launch a full suite of pre-IPO services to attract private Tech listing candidates to Euronext’s markets, supporting their growth financing needs.
Euronext has the ambition to become the leading global ESG financing venue, and the partner of choice for issuers in the sustainable transition. The Group has launched My ESG Profile, making individual data of issuers available on the Euronext website in a standardised form, using more than 60,000 ESG data points. Euronext has also expanded ESG bonds to track the 1.5-degree ambitions of ESG bond issuers, flagging taxonomy-eligible issuers to increase their visibility to investors. Please refer to section 3 - Empower Sustainable Finance for more details.
Capitalising on accelerated trends towards digitalisation, Euronext Corporate Services has successfully delivered 24% revenue compound annual growth rate (CAGR) between 2018 and 2021, and it now serves over 4,800 clients in 30 countries, spanning listed and private companies, as well as public sector entities. Euronext Corporate Services has transformed several single-product companies into a pan-European multi-product business, supporting clients’ needs in compliance, communication, governance, and investor relations. Euronext will continue to grow Corporate Services further by consolidating its position in core domestic countries, growing internationally in new strategic markets, and continuously developing the portfolio of solutions, with a specific focus on Compliance.
Euronext operates seven regulated markets and is the number one European cash equity trading venue, with €10.1 billion of cash average daily volumes (ADV)8, representing a quarter of European lit volumes. Euronext has shown a unique track record in the management of cash trading market share and value extraction. Euronext has leveraged its unified markets with a standardised approach across Europe, while protecting local specificities and ecosystems. Euronext wishes to consolidate its European scale and maximise touchpoints upstream in the value chain. This strategy, combined with the Core Data Centre migration, the migration of Borsa Italiana capital markets to Optiq® and the European expansion of Euronext Clearing clearing activities, aims to build the launchpad for an integrated European market.
Euronext aims to continue to be the most liquid and largest trading venue in Europe, and to extract superior value from cash trading activities. It will develop a new generation of pricing strategies, built on its years of expertise, to support yields and market quality. It will continue to support diversity of flows by offering a trading model that meets the needs of both local and global players to offer a best-in-class trading experience for retail and institutional investors.
The derivatives franchise will be strengthened by expanding to new geographies and leveraging Borsa Italiana markets, and by developing more ESG-related products. The European expansion of the Euronext Clearing clearing operations will give Euronext the flexibility to develop products to meet client demand quickly and efficiently.
Euronext offers its clients the option of exposure to crypto-assets through a suite of new products. After the recent success of the listing of cryptocurrency exchange traded products (ETPs) on Euronext, the Group will continue to expand its crypto-tracking ETP offering. Euronext proposes a new family of Euronext branded crypto-indices to support the launch of related products. Moving forward, Euronext will provide its clients with exposure to crypto-assets with the same level of regulatory security and operational efficiency as on Euronext’s core markets.
Euronext’s Advanced Data Services business will scale up by leveraging the most comprehensive cash equity data in Europe, its fast-growing index franchise, and new datasets from recent acquisitions. Euronext aims to become the number one European ESG index provider, leveraging national brands, strong local presence and its ecosystem of innovative ESG data partners (refer to section 3 - Empower Sustainable Finance for more details). Euronext will build on recent successes to further deepen its relationship with exchange traded fund (ETF) issuers and asset owners. It will take its data analytics offering to the next level by building on leading quant capabilities and the most advanced data products tailored to end-user client segments. And Euronext will also monetise non-public proprietary data and extend its expertise to new datasets from recently integrated businesses, such as fixed income.
Euronext will support the evolving use of market data and adapt its product suite and commercial policies to new usage demands. It will leverage technology, both cloud and digital, to transform data servicing and data distribution, benefiting from the Group’s new scale.
Euronext continually develops its existing architecture and ensures business scalability using cloud, microservices and application programming interface services. Harmonisation of its infrastructure, especially across Euronext’s CSD network, will permit further efficiencies. Euronext will also harness data science to develop innovative solutions, products and services.
Euronext has consistently invested in resiliency and platform stability, and its proprietary Optiq® trading platform handled trading volatility peaks seamlessly in 2020, 2021 and 2022. To continuously improve the monitoring of its IT systems along the trading chain, Euronext has developed a set of best practices supported by a comprehensive data-driven operational risk framework.
Euronext has significantly invested in and improved its crisis management framework. It performs regular stress training, relying on a robust playbook for decision-making and a comprehensive crisis communication plan. In the years to come, Euronext will continue to invest to deliver best-in-class resiliency and stability for its platform, while offering new services and products. Furthermore, Euronext will extend the use of artificial intelligence to improve data analysis and infrastructure agility.
Customer satisfaction is at the centre of Euronext’s strategy. Investment in enhanced digital tools will allow the Group to offer a better and more unified customer experience.
IV. Empower sustainable finance through an ambitious environmental, social, and governance (ESG) strategy
The world has entered a decisive decade for the achievement of the objective of the Paris Agreement to keep the global temperature increase at well below 2 degrees compared to pre-industrial levels. Urgent action is required now, from companies and from the financial sector more broadly, to avoid the negative effects of climate change.
Against this backdrop, Euronext is leveraging its ESG performance to build an impactful ESG strategy. The new sustainability strategy focuses on accelerating climate action both in Euronext’s operations and through the role it plays in empowering sustainable finance across all its markets.
Euronext is proud to announce the launch of its “Fit for 1.5°” climate commitment, for itself, its partners and its clients.
Euronext has set science-based quantitative climate targets by signing the “Business Ambition for 1.5°C”, a campaign led by the Science Based Targets initiative (SBTi)9 in partnership with the United Nations Race to Zero campaign.
Applying the SBTi methodology to Euronext emissions led to the formulation of the following targets that have been validated by SBTi in February 2023:
■ By 2030, Euronext will reduce its Scope 1 and Scope 2 market-based greenhouse gas emissions by 73.5% compared to 2020; ■ By 2030, Euronext will reduce its scope 3 business travel emissions by at least 46.2% compared to 2019; ■ By 2027, Euronext suppliers, representing 72% of Euronext’s greenhouse gas emissions derived from purchased goods and services, must set targets on their Scope 1 and Scope 2 emission. The relocation of Euronext’s Core Data Centre to a green facility has been the first move to follow through on this transformational commitment. The new data centre is powered 100% by renewable energy sources, much of which is self-produced through solar panels and hydroelectric power stations. The migration to a sustainable data centre sets the standard for the industry and provides clients with concrete tools to improve their own carbon footprint.
Furthermore, Euronext is developing services and products to accelerate the transition to a European economy aligned with a 1.5-degree trajectory. This will help drive investment towards decarbonised assets and support Euronext’s clients on their ESG journey. Solutions supporting the strategy include, among others, the creation of a climate transition market segment, dedicated to issuers committed to science-based targets, the creation of climate and ESG versions of Euronext’s national benchmark indices, revised ESG reporting guidance for issuers focusing on climate, and low-carbon colocation services.
Euronext will complement this environmental focus by implementing a forward-looking and outcome-based approach across all its impact areas, including human capital, community investment and governance issues that are material to its industry with a view to improving its overall ESG ratings relative to peers.
Euronext is diverse by nature and by commitment, with 63 nationalities across 18 countries, and a genuinely inclusive culture, embedded in its federal model. The Euronext Managing Board, Senior Leadership Team and Supervisory Board have reached their gender diversity targets in two years, with 30%, 30% and 40% gender diversity respectively already delivered. Euronext will go further, and will reach a 30% target in average on local Boards by 2024 and has extended its 30% targets to the management levels below the Senior Leadership Team in 2023.
Building on the success of Euronext’s Diversity Day and International Women’s Day initiatives, each Euronext country has taken the commitment to reinforce local diversity partnerships with schools and recruitment providers, as well as early mentoring programmes as part of the Group’s financial literacy initiatives. Euronext sees all forms of diversity, including disability, gender, sexual orientation, age, and cultural background, as a key success factor of its federal model, and is committed to further improve diversity practices in the next three years. This commitment will be reinforced in all its people practices through its people integration programme across Europe.
Euronext will pursue its growth strategy through high value-added acquisitions aimed at diversifying and strengthening the business profile of the Group, with a specific focus on Europe.
Euronext will maintain a rigorous investment policy, with a targeted return on capital employed (ROCE) of acquisitions above weighted average cost of capital (WACC) between years 3 to 5. As a key market infrastructure, Euronext expects to maintain its investment grade while leveraging its financial flexibility to capture market opportunities that arise. On 9 February 2023, Euronext has been upgraded by S&P to a BBB+ rating.
Euronext’s growth ambition is reflected in the 2024 financial targets and a rigorous capital allocation strategy.
■ Revenue is expected to grow by +3% to +4% CAGR2020Proforma-2024E, excluding potential acquisitions, driven by (i) organic growth, especially in services, and (ii) growth initiatives related to Borsa Italiana integration. ■ EBITDA is expected to grow by +5% to +6% CAGR2020PF-2024E, excluding potential acquisitions, driven by (i) continued best-in-class cost discipline, (ii) investments in operational excellence and (iii) uplift profitability of already-acquired companies to Euronext’s level. ■ Euronext expects to achieve €115 million of run-rate pre-tax synergies related to the Borsa Italiana Group acquisition by 2024 (€100 million previously announced on November 2021), up c. 92% compared to the €60 million of synergies announced at the time of the acquisition in April 2021, to incur €150 million of non-recurring implementation costs (€160 million previously announced on November 2021). More than 60% of those synergies are related to growth projects. ■ Capex is confirmed at between 3% and 5% of revenue. ■ Dividend policy is set at 50% pay-out of reported net income. -
1.3 Description of the Business
In accordance with Article 19 of Regulation (EU) 2017/1129, the following information is incorporated by reference in the Universal Registration Document:
The description of principal activities of the Company for the financial year 2022, presented on pages 26 to 46 of the 2022 Universal Registration Document filed with the Autoriteit Financiële Markten on 31 March 2022 and available at:
https://www.euronext.com/sites/default/files/financial-event-doc/2023-08/EUR_2022_URD_MEL%20FINALE_AUG.pdf
The description of principal activities of the Company for the financial year 2021, presented on pages 24 to 43 of the 2021 Universal Registration Document filed with the Autoriteit Financiële Markten on 31 March 2022 and available at:
https://www.euronext.com/sites/default/files/financial-event-doc/2022-04/2021%20URD%20-%20ENX%20-%20PDF_1.pdf
1.3.1 BUSINESS OVERVIEW
Euronext is the leading pan-European market infrastructure offering a diverse range of products and services and combining transparent and efficient equity, fixed income securities and derivatives markets in Amsterdam, Brussels, Dublin, Lisbon, Milan, Oslo and Paris. Euronext operates various businesses in 18 countries. Euronext’s businesses comprise listing, cash trading, derivatives trading, spot FX trading, fixed income trading, power trading, investor services, advanced data services, post-trade, technologies & other.
Euronext is the leading listing venue in Europe and attracted 64 new equity listings in 2023. Euronext markets provide the leading listing venues in continental Europe based on the number of companies listed as of 31 December 2023. Close to 1,930 issuers representing a combined market capitalisation of approximately €6.6 trillion were admitted to trading on Euronext’s markets as at 31 December 2023. As of 31 December 2023, Euronext ranked first in Europe in terms of market capitalisation of listed companies and first among the largest exchange groups in Europe in terms of number of companies listed, excluding Bolsas y Mercados Españoles (on which a large proportion of listed issuers are open-ended investment companies, limiting comparability). In addition, the Company has over 3,800 exchange traded products (ETPs)1 and close to 2,500 funds listed on its markets as of 31 December 2023.
Euronext ranked first among all trading venues in Europe in terms of monthly lit continuous & auctions order book trading volume in equities for the last 12 months ended 31 December 2023 among all trading venues in Europe.
Euronext’s pan-European cash equities trading venue is the market leader in cash equity trading in its seven home continental European markets of Belgium, France, Ireland, Italy, the Netherlands, Norway and Portugal, as of 31 December 2023. Average Daily Value on cash trading amounted to €10.1 billion in 2023, representing around 25% of the total European lit equity trading markets. Euronext market share in cash equities trading of the securities listed on its markets reached 65.1% over 2023. Euronext provides multiple marketplaces including its Multilateral Trading Facilities (MTFs), for investors, broker-dealers and other market participants to meet directly to buy and sell cash equities, fixed income securities and exchange traded products (ETPs).
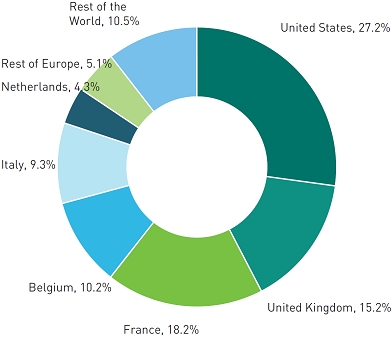
Euronext is also the number one venue for the listing of bonds globally, with over 9,700 new bond listings in 2023 and a total number of listed bonds exceeding 55,000 at the end of 2023, surpassing 2022’s total of more than 53,000 listed bonds. Bond listing is an international business activity with over 4,000 issuers coming from more than 100 jurisdictions across the globe.
1 Including exchange traded funds (ETF), exchange traded commodities (ETC) and exchange traded notes (ETN)
Euronext, with its regulated markets (in Paris, Brussels, Milan, Amsterdam, Lisbon) and MTFs (EuroTLX, ExtraMOT, Growth, Access, GEM) is a leading European platform for the electronic trading of fixed income securities in retail size / odd-lots. In 2023, average daily volume for retail fixed income trading on Euronext markets reached €1.3 billion.
Euronext’s derivatives trading business has a strong market position in futures and options on benchmark indices such as the CAC 40®, AEX®, BEL 20®, ISEQ®, OBX® and PSI® and FTSE® MIB, single stock options and futures and commodity derivatives. It ranks second among European exchange groups in terms of open interest of derivatives traded as at 31 December 2023. Euronext offers options contracts based on all of the blue-chip equities listed on Euronext, thereby reinforcing liquidity for those equities. This includes the components of Euronext’s flagship national indices such as the CAC 40®, the second most traded national index in Europe. The commodity derivatives offered by the derivatives trading business include the milling wheat futures contract which is a world-class contract for the European Union agriculture market.
Since April 2021, Euronext is the owner of MTS2, the leading European fixed income trading platform, number one in Europe for Dealer-to-Dealer (D2D) European Government bonds trading, number one in Italian repo trading and number three in Europe for Dealer-to-Client (D2C) European Government bonds trading.
Euronext’s advanced data services business distributes and sells real-time, historic and reference data to global data vendors, such as LSEG Refinitiv and Bloomberg, as well as to financial institutions and individual investors. With a portfolio of over 1,250 benchmark indices, including the CAC 40® index in France and AEX® index in the Netherlands, Euronext is a leading provider of indices and a provider of advanced analytics products. Euronext’s blue-chip index franchise was enriched in 2023 through the addition of the CAC SBT 1.5 index family. Euronext is one of the leading ESG index issuers in Europe, with more than 18 new ESG indices launched in 2023 and a strong pipeline.
Post trade is an important part of the services Euronext provides to its clients. In 2013, the Company entered into a clearing agreement with LCH S.A., the Paris-based clearing house of LCH Group Limited (LCH Group), for the clearing of Euronext’s cash products. In 2017, Euronext renewed the separate derivatives clearing agreement with LCH S.A. that provides for a revenue sharing arrangement in respect of the clearing of Euronext listed derivativesl. On 29 April 2021, Euronext acquired the multi-asset clearing house CC&G, which it will grow into Euronext Clearing, making it by 2024 Euronext’s CCP of choice for its cash equity, listed derivatives and commodities markets. In January 2023, Euronext has decided to terminate the existing derivatives clearing agreement (the “Agreement”) with LCH SA, under the terms of the Agreement. Therefore, on 16 January 2023, Euronext served LCH SA notice of termination for the purposes of the Agreement. Since 2016, Euronext also offers user choice in clearing for the equity markets within the Eurozone, through the implementation of a preferred Central Counterparty (CCP) model followed by a fully interoperable service. Euronext continues to offer an open access CCP model for cash equity clearing.
In addition, Euronext owns and operates Euronext Securities Porto, the Portuguese national Central Securities Depository (CSD); Euronext Securities Oslo, the Norwegian national CSD; Euronext Securities Copenhagen, the Danish national CSD; and Euronext Securities Milan, the Italian national CSD. The Group is now the third-largest CSD operator in Europe. Euronext has combined its four CSD brands into Euronext Securities, a new umbrella brand for its CSD business, while keeping a strong local presence and identity.
Euronext Technology Solutions & other comprises Euronext’s commercial technology solutions and services business, and former Borsa Italiana businesses including Gatelab and Integrated Technology Services ‘X2M’. Euronext offers custom solutions and cost-effective services to exchanges, venue operators, and financial institutions, who require advanced functional capabilities, and low latency processing across multiple-asset classes surrounded by exchange grade business services used to operating within highly regulated environments.
The successful migration of the Euronext Core Data Centre facility from Basildon, in the United Kingdom, to Bergamo, in Italy has provided clients with a state-of-the-art colocation facility and connectivity services fully managed by Euronext within a data centre powered by renewable energy. Colocation and connectivity services have become an important source of revenue for Euronext Technology Solutions.
-
1.4 Regulation
1.4.1 OVERVIEW
The Euronext Group provides exchange listing, trading, post-trade and related services in Europe. The Company operates Regulated Markets and Multilateral Trading Facilities (MTFs) in seven European countries (Belgium, France, Ireland, Italy, the Netherlands, Norway, and Portugal). The Group operates these venues under a regulatory licence, under national legislation implementing MiFID II / MiFIR granted to the local market operator and the relevant National Competent Authority (NCA) or Ministry when appropriate. Each market operator is subject to the national laws and regulations supervised by the NCAs, central banks and finance ministries as appropriate. As part of their regular supervision, NCAs perform from time-to-time audits, inspections and on-site visits. This may lead to recommendations or other measures as appropriate.
The Group also operates central securities depositories (CSDs) in four European countries (Denmark, Italy, Norway and Portugal). Each of the CSDs is a limited liability company subject to national laws and regulations; however they all operate under the brand “Euronext Securities”. VP Securities AS (Euronext Securities Copenhagen), Monte Titoli S.p.A. (Euronext Securities Milan), Interbolsa S.A. (Euronext Securities Porto), and Verdipapirsentralen ASA (Euronext Securities Oslo) hold a licence under the CSDR, under limited national implementing provisions, granted by their NCA on 3 January 2018,18 December 2019,12 July 2018, and 28 January 2022 respectively.
Euronext, through Euronext Securities Copenhagen, Euronext Securities Milan and Euronext Securities Porto, participates in the ECB’s TARGET2-Securities (T2S) platform. The CSDs migrated respectively in September 2016 (Danish Kroner), August 2015 and March 2016.
Moreover, the Group operates a Central Counterparty in Italy, Cassa di Compensazione e Garanzia S.p.A (“Euronext Clearing”). The company was incorporated on 31 March 1992, holds its registered office in Rome at Via Tomacelli 146, and is registered with the Italian Register of Companies under no. 04289511000. It is authorised by the Bank of Italy as a CCP pursuant to Article 17 of EMIR with effect from 20 May 2014.
-
2 RISK MANAGEMENT & CONTROL STRUCTURE |DR|
Euronext analyses and monitors risks related to its activities with specific attention those whose occurrence could have a material impact on the Group’s business. The table of the Group’s principal risks categorises, the most material risks taking into account the impact and the probability of their occurrence.
Although Euronext believes that the risks and uncertainties described below are the material risks and uncertainties concerning the Group’s business and industry, they are not the only risks and uncertainties relating to the Group. Other risks, events, facts or circumstances not presently known to Euronext, or that Euronext currently deems to be immaterial could, individually or cumulatively, prove to be important and may have a significant negative impact on the Group.
2.1 Risk Factors
Strategic Risks Strategic Transformation Risk Regulatory Evolution and Enhanced Regulatory Scrutiny Risk Global and Regional Economy Risk Competition Risk Operational Risks Cyber Security Risk 
Technology Risk 
Third Party Risk Business Continuity Risk Employee Risk 
Regulatory and Liabilities Risk Financial Risks Credit Risk Market Risk Liquidity Risk Capital Requirements Risk Euronext recognises the importance of environmental, social and governance (“ESG”) related risks. Based on our 2023 risk analysis, no material residual (unmitigated) ESG core business risks have been identified as impacting the operations, revenues and stakeholders of the Group.
The risk factors annotated by a reference symbol indicate material business risks that have an ESG dimension and link to the key ESG issues as identified by the Group’s external stakeholders in the Group ESG materiality matrix (see Section 3.1 - Value Creation by Euronext of this document for more information) labelled under 5 impact areas have been identified according to these categories.
Risk Identification and Description Potential Impact on the Group The Group’s strategy includes the identification and implementation of organic initiatives and new business initiatives such as acquisitions and partnerships.
The market for acquisition targets and strategic alliances is highly competitive, the Group acts on opportunities as they arise and may continue to enter into simultaneous business combination transactions.
The size, number and complexity of past acquisitions and those that may be executed in the near future, as well as ongoing enhancement programmes creates a strategic transformation risk for the Group.
Notably, the Group has continued the integration of Borsa Italiana which is principally driven by the migration of Borsa Italiana markets to the Optiq® platform and the expansion of the Group’s CCP, Euronext Clearing.
Over 2023, the Group achieved two significant milestones with respect to the migration of Borsa Italiana markets to the Optiq® platform, and is expected to complete the final milestone in the first half of 2024. The Group delivered the first milestone of its CCP expansion with the internalisation of its cash equity clearing for non-Borsa Italiana markets onto Euronext Clearing in 2024, the final milestone is expected in mid-2024.
There are varying degrees of dependency between the above-mentioned projects and there is a risk that, should the last milestone of the Optiq® migration project be significantly delayed, the second phase of the Clearing expansion may be impacted.
Beyond the above mentioned projects, the Group is undergoing other group-wide business transformation programs, including the development of its convergence plan across the Group CSDs.
Pursuing strategic transactions requires substantial time and attention of the management team, and of key employees managing or working on the integration/project activities. This could prevent oversight of other initiatives, reduce bandwidth for business as usual activities and slow other ongoing projects or initiatives. Late, incomplete or unsuccessful integrations or projects may impact the Group’s strategic plan, business, reputation and financial results.
The ability to adapt to a rapidly changing company culture by Euronext’s employees is necessary to ensure successful integrations and transformation. Failure to meet the demands of the changing company culture could negatively impact the advancement of projects and successful integration.
If integration programs are not completed, do not operate as intended, are delayed or identified synergies are not delivered, Euronext’s strategic ambition and reputation may be at risk.
Risk Identification and Description Potential Impact on the Group The Group’s businesses are subject to extensive regulation and supervision at both European and national levels in the jurisdictions in which the Group has operations: Belgium, Denmark, France, Ireland, Italy, the Netherlands, Norway, Portugal and the United Kingdom. In addition, the Company has a presence in the United States, Singapore, Finland and India.
Regulatory changes may impact the operating environment of Euronext exposing the Group to risks associated with the implementation and maintenance of compliance with new regulatory requirements. As the Group expands, so has the scope of regulatory requirements to which it is subject and the breadth of relevant relationships it must maintain. The regulatory environment is an important element that may limit the ability of the Group or its entities to provide certain current or planned services, or build an efficient, competitive organisation.
The Group must obtain regulatory approval to implement significant changes to the operations of its trading venues, and material changes to operations and models of its CCP and CSDs. Transformational cross-organisation projects include the Borsa Italiana markets migration to Optiq and the expansion of Euronext Clearing. Failure to obtain required approvals, which may need approval by multiple regulators, may delay or prevent the Group from achieving its strategic objectives.
With regards to MiFID II/MiFIR, an agreement on the Commission proposal was struck in the summer of 2023, however the official text has yet to be adopted and published. The outcome represents a risk for market data revenues. The scope of the pre-trade consolidated tape is limited to anonymised top-of book EBBO data, shares and ETFs, while post-trade data applies to shares, ETFs, bonds, and OTC derivatives. The revised market structure regulatory framework, may potentially benefit off-venue trading with alleviations introduced on bank internalisation. At the same time, a ban on Payment for Order Flow (PFOF) has been introduced, including a grandfathering provision for member states with existing structures in place until June 2026.
The Commission proposal for the Benchmark Regulation review should be positive as it aims to limit the framework to critical, significant and environmental benchmarks and is expected to apply in 2026. The Commission proposal on the Retail Investment Strategy seeks to improve the framework for retail investors, and there is a risk, subject to the final outcome, of unintended consequences in terms of limiting retail access to financial markets further. The Commission proposal on ESG Ratings seeks to install safeguards on transparency and is expected to be positive for the market that relies on ESG ratings.
In December 2022, the Commission proposed a review of EMIR and a new Listings Act, both which are potentially positive. The Listing Act is expected to be agreed in Q1 2024 with the aim of simplifying the listing process by streamlining prospectus and market abuse requirements. The EMIR review seeks to improve new product and service authorisation procedures and is expected to be agreed in 2024.
With regards to the CSDR framework, the EU Commission addresses access to commercial bank money for settlement purposes, as well as services passports, both requiring effort to implement. The Withholding Tax proposal, proposes that CSDs should register as Certified Financial Intermediaries, potentially causing additional burdens in this area.
Beyond market infrastructure regulation, the Group is subject to increased regulation in the areas of IT, cybersecurity, and outsourcing, particularly with the Digital Operational Resilience Act (DORA) which will be applicable in 2025. Level 2 Regulation is being prepared and consultations will continue over the course of 2024.
In 2023 the Distributed Ledger Technology (DLT) Pilot Regime entered into force permitting exemptions to MIFID and CSDR to manage financial instruments through new DLT infrastructures that could benefit from these exemptions, potentially increasing competition. The Markets in Cypto Assets (MICA) Regulation will be applicable in 2024 regulating the provision of services of crypto assets potentially allowing crypto asset service providers to leverage their more regulated structure and start competing on traditional financial instruments.
ESG regulation continues to evolve, with the final four objectives of the EU Taxonomy for Sustainable Activities published in 2023. The Corporate Sustainability Reporting Directive (CSRD) was finalised and will be transposed into national regulations in 2024. The negotiations of the Corporate Sustainability Due Diligence Directive (CSDDD) were provisional agreed in December 2023, however during a meeting of the Coreper in February 2024, the agreement failed to receive sufficient support at the European Council level.
Decisions by Euronext’s regulators to impose measures may impact the competitive situation and possible strategy of the Group. Adherence to new and evolving regulatory regimes implied increase compliance and associated costs for the Group, for instance by requiring the businesses of the Group to devote substantial time and cost to the implementation of new rules and related changes in their operations. It may also impact the ability to outsource certain activities and/or place financial and corporate governance restrictions on the Group and its entities.
As the Group grows its product base and the jurisdictions in which it operates, regulatory oversight of the Group’s activities by additional regulatory bodies potentially increases regulatory constraints or increases compliance requirements if adversely designed could materially increase the costs of, and restrictions, of its activities.
Delays or denials by regulatory authorities of approvals requested by Euronext required to implement its strategic initiative, or to pursue business opportunities could have a significant impact on Euronext’s competitive positioning and growth.
The impacts of the proposed amendments to MiFIR remain difficult to assess. The changes to the structure of the market data business including both reasonable commercial basis provisions and the creation of a consolidated tape may negatively impact market data business revenues in the medium term. The same may be the case for market structure reforms.
On the post-trade side, the CSDR and EMIR Reviews are generally positive for the Group, potentially facilitating these businesses, however, the legislative process still needs to be finalised. The potential impact of the EMIR review is expected to include changes to the supervisory regime, authorisation procedures foreseen within EMIR, which may result in the relocation of clearing flows related to certain derivatives asset classes from the UK to the EU. The Withholding Tax proposal may however add regulatory burdens on CSDs. The Benchmark Review may reduce regulatory burdens on the indices offered by the Group.
With respect to the DLT Pilot Regime and MICA Regulation, in the medium term, the estimated impact, due to the asset perimeter is expected to be limited. In the longer term, more flexible provisions of digital finance may be extended to a broader asset perimeter, and enable new competition on Euronext’s core activities, with the main impacts expected on bond listing, post-trade and retail trading activities.
If competitors (including those in third party jurisdictions) can obtain regulatory approval for similar products (including new digital products) or services faster than established entities such as the Group or its subsidiaries, or with lower regulatory burdens than regulated entities, the Group’s competitive position may be weakened.
Well-designed legislation in respect of IT, cyber security and outsourcing, notably DORA can be expected to assist the Group in its operations on a cross-border basis, particularly in harmonising reporting obligations. However, compliance risks can be expected to increase.
ESG regulations require increasing time and resources to ensure correct implementation and continued compliance changes and adaptation processes, including training and awareness for employees. Potential impacts of new regulations will be determined by the scope of application of new regulations and directives.
Risk Identification and Description Potential Impact on the Group The Group is exposed to global and regional economic, political and geopolitical market conditions, macro-economic changes in global or regional demand or supply shifts and legislative changes across several jurisdictions, which can affect the level of global and local financial activity.
The general economic conditions as well as unanticipated, impactful events, and general economic conditions affect financial and securities markets in a number of ways, from determining availability of capital, to influencing investor confidence. Adverse changes in the economy or the outlook for the financial and securities industry can have a negative impact on the Group’s revenues through declines in new listings, trading, clearing and settlement volumes, and demand for market data.
Starting in 2022, inflation in Europe and the US increased to its highest in several decades, driven by the lingering impacts from the pandemic and its recovery, and exacerbated by the war in Ukraine and subsequent sanctions to the Russian invasion. Over 2023, inflation continued however slowing as Government responses to curb inflation continued over 2023. In the second half of 2023 Central Banks slowed the increase of interest rates buoying the economy and supporting equity trading and valuations and ultimately business activity. Market and FED expectations are for 75 basis point rate cut in 2024, supporting economic growth.
GDP in the euro area, where the Group’s activities are concentrated, was weaker in 2023 than expected due to Germany’s slowdown and 2024 may confirm this trend. Eurozone GDP growth in 2024 is expected to be close to zero to 0.5%. Low or negative growth may impact trading, and increased credit risk in the Euro area, reduce appetite for risk including trading activities by participants. Additionally, primary listing activities have been impacted given challenging market conditions in 2023 and may continue in 2024 further impacting the Group.
While volatility may drive volumes on trading venues, the recession and slow GDP growth may be reflected in issuance and trading, clearing and settlement volumes, and demand for market data, which may negatively impact Group revenue and growth targets. Declines in volumes may also impact the Group’s market share or pricing structures.
The expected recessionary and increasing credit risk environment may negatively impact markets, which may experience a “flight to quality”, negatively impacting business where the Group has activities. Further, a flight to quality may result in less volatile BTP-Bund spreads, the trend over 2023 was a tightening of the spread versus increasing spread, volume is expected to continue in the first half of 2024 maintaining the overall volume of bonds traded on Group markets on the upside.
In case of a temporary recession the impact on the Group may be muted due to potential opportunities of portfolio reallocation. Should a recession be persistent, higher credit risk, increased bond spreads, and impacts to market liquidity, may result in participants reducing their trading activity and suspending potential listings.
Risk Identification and Description Potential Impact on the Group The industry in which the Group operates is highly competitive. In particular, the Group’s trading business is facing market fragmentation and increased competition, from OTC and bilateral trading, systematic internalisers and Multilateral Trading Facilities (MTFs). The listing business is facing competition from Regulated Markets as well as private equity funding.
Competition has intensified due to trends including:
■technological innovation;■the globalisation of capital markets, which has resulted in greater mobility of capital, greater international participation in local regions and more competition among different geographical areas;■the continued expansion of other market participants impacting volumes on our markets;■the growing appeal of private equity; and,■increased competition among exchanges, central counterparties and CSDs.The Group competes with other market infrastructures on:
■diversity of flows,■index, clearing, issuance and settlement services,■data and quantitative research;■ease of use and performance of trading, clearing and settlement systems including quality and speed of execution and functionality;■range of products and services offered to customers, trading and clearing participants and listed companies; and■adoption of technological advancements.Competition on price across each of the Group’s product areas including, trade execution, post-trade services, market data, and technology continue, and is expected to persist. Finally, competition may intensify further should certain rules, regulation and circumstances change.
Should the Group be unable to adapt to continued changing market pressures, evolving customer demands, or is required to adapt its pricing structure, revenues and profit margins could decline.
The success of the Group’s business depends on its ability to attract and maintain order flow, both in absolute terms and relative to other market infrastructures, and the loss of order flow would negatively impact the Group’s sources of liquidity and its market position, which could have a material adverse effect on the Group’s business, results of operations, financial condition and prospects.
Intensifying competition among exchanges and private equity offers may have a negative impact on listing fees and future trading fees.
Risk Identification and Description Potential Impact on the Group Cyber resilience is a critical priority for the Group. The Group’s growth footprint and threat landscape in terms of employees, geographical, and business footprint increases the Group’s exposure to cybersecurity threats meaning that secure transmission of business information over public and other networks are critical elements to the Group’s operations.
The volume of cyber-attacks has been increasing in general and, consequently, within the financial sector. As the Group expands, it accumulates, stores, and uses more business data which are protected by business contracts and regulated by various laws, including data protection, in the countries in which it operates. The Group expansion also leads to an enlarged global footprint, expanding the overall attack surface.
The Group may be exposed to exploitation of its internet exposed applications by malicious actors, data leakage, including ransomware, unauthorized access or other security incidents including:
■Breaches at the level of third parties, including cloud computing services, to whom Euronext provides information and may not be fully diligent in safeguarding it.■DDoS threats on internet exposed assets and applications of the Group.■Attacks leveraging potentially unsecure internet connections for employees working remotely.■Advanced persistent threats from highly sophisticated attackers including state sponsored or organised crime hacking groups with malicious intentions which may target the financial sector.■Third-party software used by Euronext within its context and software solutions, which is available to the public and may be exposed to unknown or undisclosed vulnerabilities (zero-days).■Phishing attacks targeting Group employees.■Persons who circumvent deployed security measures that could wrongfully access the Group’s or its customers information, or cause interruptions or malfunctions in the Group’s operations. Data protection regulations increase the risks associated with regulatory non-compliance in case there is an incident.The impact of a successful cybersecurity attack depends on the nature and scope of the attack, for example:
■Security breaches, leaks, loss or theft of sensitive, personal, strategic or confidential data, including data subject to protection laws, and other related security incidents could cause Euronext to incur reputational damage, regulatory sanctions, litigation and/or have an impact on its financial results.■A successful cybersecurity attack on the Group’s IT systems may affect the confidentiality, availability or integrity of information.■A cybersecurity attack may result in system operational failures due to vulnerability exploitation.■Internet facing Systems may face downtime due to DDoS attack.The Group is committed to maintaining and safeguarding its IT systems and information, with particular attention on external growing threats and threat actors (such as cybercriminals). However, malfunctions, significant disruption, loss or disclosure of sensitive data could disrupt the Group’s operations, result in significant reputational harm or have a material adverse effect on the Group’s business, results of operations, financial condition and prospects.
Risk Identification and Description Potential Impact on the Group Technology is a key component of Euronext’s business strategy, and is crucial to the Company’s success. Euronext’s business depends on the security, performance and stability of complex computer and communications systems. The ability to expand system capacity and performance to handle increased demand or regulatory requirements is fundamental to Group operations.
The Group’s markets have experienced systems failures and delays in the past and could experience future systems failures and delays, impacting our members and clients and related trade executions. Such failures may arise for a wide variety of reasons including hardware and software malfunctions or defects, or complications experienced in connection with the operation of such systems, including system upgrades.
The Group is currently undergoing significant technology transformation projects in line with its strategic plan. Projects include the migration of Borsa Italiana markets to the Optiq® trading platform, and the European expansion of Euronext Clearing both of which have completed significant milestones in 2023 and are expected to be completed in 2024. In addition CSD initiatives that are aimed to foster harmonisation have progressed over 2023 and will continue in 2024. The magnitude of these transformations carry project and change management risk, and once implemented, a broader technology risk that if the Group’s technology and/or information systems suffer from major or repeated failures, this could interrupt or disrupt the Group’s operations or services.
Euronext’s future success will depend, in part, on continued innovation and investment in its trading and post-trade systems and related ability to respond to customer demands, understand and react to emerging industry standards and practices on a cost-effective and timely basis.
Given the significance of ongoing integrations and projects, as well as the continuing need for effective change and integration management, to minimise disruptions, may have a negative cascading effect on strategic objectives.
Following the completion of transformation project milestones over 2023 (Borsa Italiana cash equity trading and expansion of cash equity clearing of Euronext markets (except Oslo Bors) and deployment of data centre service offerings (colocation and customer managed connectivity (CMC)) Euronext is becoming a critical service provider for some of its clients, thus increasing the impact and visibility of system failures or disruptions should they occur.
In general, should the Group’s technology not be properly managed, and system issues occur during operations, reputational damage and confidence in the Group maybe undermined, and may lead to customer claims, litigation and regulatory actions including investigations or fines.
Risk Identification and Description Potential Impact on the Group There is a risk that if one of the Group’s third party services providers suffer from major or repeated failures, Group operations or services could be interrupted or disrupted.
Technology Service Providers
the Aruba data centre located near Bergamo (Italy), is critical third party for the Group housing its core data centre, the Group has internalised a number of data centre services while third parties offer complementary services reducing dependencies on third parties. The Group continues to depend on Equinix who provides the secondary data centre.
Euronext depends on Amazon Web Services (AWS) for select cloud services, notably for regulatory and external reporting.
With respect security services the Group relies on Cap Gemini for services related to its Security Operations Centre to assisting the permanent monitoring of the Group’s environments.
Clearing Service Providers and Settlement Partners
In Q4 2023 the Group’s CCP, Euronext Clearing, replaced LCH S.A., a central clearing party owned by LSEG Group, as the default CCP for its trading venues for equity cash clearing reducing its dependence on this third part. However, open access is maintained via the Preferred CCP Model under which LCH S.A. and CBOE Clear Europe which remain preferred CCPs for all trading venues with the exception of Oslo. With respect to Oslo cash markets, Euronext Oslo relies on three interoperable CCPs: LCH Ltd, Cboe Clear Europe and Six X Clear.
LCH S.A. will remain the CCP for trades executed on the Group’s derivatives markets (excluding Borsa Italiana) until the completion of the Group CCP expansion of its derivatives markets in 2024. Borsa Italiana derivatives are already cleared by the Group’s CCP.
LCH SA together with the Group’s CCP provide clearing for the fixed instruments traded on MTS platform via the interoperability link established between these two CCPs.
The settlement of trades concluded on the Group’s trading venues relies not only the Group’s own CSDs but also on third party CSDs, according to the type of securities to be settled.
Technology Service Providers
Euronext actively manages its relationships with its key strategic technology suppliers, and includes framework Service Level Agreements to ensure services are guaranteed. However, should a significant disruption occur, including a discontinuation of services or a service failure, the Group may experience significant disruption to its business and may be subject to, reputational damage, litigation by its customers or increased regulatory scrutiny or regulatory fines.
Clearing Service Providers and Settlement Partners
To the extent that any of the entities providing clearing or settlement for trades concluded on Euronext markets experience difficulties, materially change its business relationship with the Group, or are unable for any reason to perform its obligations, the Group may suffer negative impacts on its operations, business, reputation, and financial results.
Business Continuity Risk
Risk Identification and Description
Potential Impact on the Group Business continuity a key objective of the Group’s operational resilience strategy, helps to address the Group’s ability to prevent, adapt, respond and recover from operational disruptions to minimise the impact on our customers and on the financial stability of capital markets.
The energy crisis experienced in Europe in 2022 has been largely tempered in 2023. The Group continues to monitor the situation should underlying tensions increase.
The rise of social and environmental tensions in Europe may create pressure on the physical security of facilities and well-being of employees.
Unforeseen events such as physical security and system security threats, epidemic or pandemic, or a major system breakdown, could impact the continuity of the Group’s services operation, reputation and its financial condition, cause financial detriment both internally and externally to the wider market.
Should an energy crisis or significant social disruption occur, the Group, particularly its critical services or its critical service providers of the Group including data centres be impacted, the Group may not be able to run its critical operations without disruption or diminished service which may negatively impact the reputation and financial results and of the Group.
Employee Risk
Risk Identification and Description
Potential Impact on the Group People management is a key component of Euronext’s business and ESG strategy, and is crucial to the Group’s success.
People risks could arise from a lack of critical skills, which could impact the ability for the Group to deliver its objectives.
The ability to attract and retain key employees and critical skills is dependent on many factors including market conditions, internal talent development and compensation practices, and employee engagement initiatives. A people strategy to support the Group strategy and company purpose, a structured organisation and a diverse workforce are necessary to ensure people engagement and performance.
An inability to attract skilled senior management and other key people at the right time and with the right skills could impact delivery of some projects and financial objectives at business line level. Employee turnover is not expected to impact the business or operational resilience of the Group. Regulatory and Liabilities Risk
Risk Identification and Description
Potential Impact on the Group Euronext operates in a highly regulated environment with multiple regulators which highlights a potential risk that one or more of the Group’s entities may fail to comply with the regulatory or contractual requirements to which it is subject. Compliance risk may arise under laws and regulations relating to financial markets and services, insurance, tax, employee behaviour, misuse of information systems, technology, data and intellectual property of others, data privacy, market abuse, corruption, anti-money laundering, financial sanctions, foreign asset controls, and data privacy and foreign corrupt practices areas.
In addition, potential liabilities may result from disputes terms of a securities trade and/or settlement, from claims that a system, or operational failure or delay caused monetary losses to a customer, as well as employment, competition matters and other commercial disputes.
Euronext N.V. licenses rights to a number of trademarks, service marks, trade names, copyrights, applications (that also embed libraries or components subject to open source licenses), products, specific deliverables, software and databases, including those of third parties. The Group’s intellectual property could be misappropriated by third parties, and/or the Group may inadvertently infringe third party IP rights during its business activities., particularly as the Group is increasingly digitalised.
Euronext could be exposed to significant fines or sanctions from relevant regulators, authorities or a court that announce adverse resolutions of any lawsuit or claim against Euronext Group as well, which could impose restrictions on how Euronext Group shall conduct its businesses and the ability to compete. This situation may expose the Group to significant reputational damage, consequences on the Group’ financial results, and the significant legal expenses in defending claims, even those without merit.
Failure to protect intellectual property (including trademarks service marks, trade names and copyrights) adequately could harm the Group’s reputation and affect its ability to compete effectively, diminish the value of that intellectual property as an asset as well as diminishing potential revenues stemming from those rights. Further, defending the Group’s intellectual property rights may require significant financial and managerial resources.
Risk Identification and Description Potential Impact on the Group Non-Clearing
The Group’s exposure to credit risk predominantly arises in the event of a counterparty default, from its operating activities, primarily trade receivables, its financing activities, and the investment in cash equivalents, short-term financial investments and derivatives contracts used for hedging purposes.
The Group’s power market is potentially subject to credit risk should one of its members default with an amount in excess of the collateral provided outstanding. The power market has a credit risk towards its main banking partner with respect to the settlement of wholesale electricity transactions.
Non-Clearing
The Group may incur a loss that would impact its net income should one of the counterparties to which it is exposed default. Adverse changes in the economic environment may increase loss allowance provisions which would negatively impact the net income of the Group.
With respect to the Group’s power market, should a participant default beyond the collateral, the entity could incur losses.
Clearing
The Group’s CCP assumes the credit counterparty risk for all cleared transactions. The credit risk is thus the risk of a CCP member default i.e. that one of the parties to a cleared transaction defaults on their obligation; in this circumstance the CCP is obliged to honour the contract on the defaulter’s behalf and thus an unmatched risk position arises. The CCP may suffer a loss in the process of closing the positions of the defaulter if the market moves against them. The CCP is required to make available a proportion of its regulatory capital available (‘skin in the game’) to cover potential residual defaulting losses following the exhaustion of the defaulter’s resources (margins and default fund contribution) before allocating remaining losses to non-defaulting members’ default fund allocation. As of February 2023 the CCP has been required to implement the regulatory “second skin in the game” to comply with the CCP Recovery and Resolution Regulation. The CCP is also exposed to Credit Risk linked to treasury counterparties default as any other entity of the Group (see Credit Risk paragraph above).
Credit risk related to CCP Investments are subject to the CCP Investment Policy which is aligned with EMIR regulation, and described under Market Risk in the “Clearing” subsection. CCP Investments over 2023 are negligible, almost all cash deposited at Central Bank.
Clearing
Should a default of a CCP clearing member not be manageable within the resources available, the CCP’s (and by extension the Group’s) reputation and financial resources may be adversely impacted.
In case of usage of the CCP’s own resources (first and second ‘Skin in the Game’) during a default of a clearing member, the CCP must restore these capital reserves to continue to fulfil the regulatory requirements. If CCP reserves and/or capital surplus are not sufficient to replenish the skin in the game contributions, CCP shareholders would be asked to replenish them by contributing in a capital injection. The financial and reputational impact of CCP recapitalisation on the Group may be significant.
Risk Identification and Description Potential Impact on the Group Non-Clearing
Market risk arises from changes in interest rates, foreign-exchange risk and other market prices.
The Group is exposed to interest rate risk on both fixed-rate bond and floating rate financial assets and liabilities, including the fixed-rate bonds and the Revolving Credit Facility.
The Group is exposed to foreign currency risk arising from the translation of assets and liabilities of subsidiaries with functional currencies other than the Euro. The Group is exposed to foreign exchange risk primarily in NOK, USD, DKK and GBP. Fluctuations may affect the Group’s profit margins and value of assets and liabilities in non-euro denominated currencies when translated into Euros.
Please refer to Note 37 in the Notes to the Financial Statements for details on sensitivity analyses performed by Group Treasury.
Non-Clearing
Increased interest rates could negatively impact the net financial income of the Group by increasing the cost of borrowing, refinancing, however having a positive impact on interest income on cash investments.
Fluctuations in non-Euro currencies particularly with respect to the NOK, USD and GBP may impact the income generated and the (regulatory) equity in these currencies when translated into Euros in the Consolidated Financial Statements.
Although the Group seeks to limit its exposure to market risks, it cannot eliminate them. As such, adverse changes in market conditions, on both interest rate and foreign currency fluctuations may negatively impact the net financial income of the Group.
Clearing
The CCP assumes the counterparty risk for all cleared transactions. This is a latent market risk as it only exists in the event of a clearing member default. In addition the risk is increased if market conditions are unfavourable at the time of default.
Regarding the CCP Investment Risk, the Group’s CCP makes investments in high-quality liquid sovereign bonds. CCP Investments over 2023 are negligible, almost all cash deposited at Central Bank. The successful operation of these investment activities is contingent on general market conditions and there is no guarantee that such investments may be exempt from unexpected losses (that could materialise in case of default of a Sovereign Country, a number of Clearing members, or unfavourable interest rate movements).
Clearing
Should a default of a CCP clearing member not be manageable within the resources available, the CCP’s (and by extension the Group’s) reputation and financial resources may be adversely impacted.
Unfavourable movements in interest rates could negatively impact the net financial income of the Group by reducing interest income.
Liquidity Risk
Risk Identification and Description
Potential Impact on the Group Non-Clearing
The Group would be exposed to a liquidity risk if its short-term liabilities become higher than its cash, cash equivalents, short-term financial investments and available bank facilities and in the case where the Group is not able to refinance this liquidity deficit, for example, through new banking lines.
The Group’s power market is exposed to liquidity risk should there be a significant delay in receiving large payments.
Clearing
The Group’s CCP is exposed to the risk of incapacity to meet cash obligations towards its Clearing Members both in standard conditions and while managing a member default.
Non-Clearing
In the event that the Group fails to maintain a level of liquidity sufficient to cover its short term obligations, it will increase its default risk, potentially damage its creditworthiness and subsequently its reputation.
Depending on the amount of the liquidity shortfall resulting from a delayed payment to the the Group’s power market’s, the Group may be asked to fill the liquidity gap in extreme circumstances.
Clearing
The Group’s CCP collects clearing members’ margin and default funds contributions in cash and/or in highly liquid securities. To maintain sufficient ongoing liquidity and immediate access to funds, the Group’s CCP deposits the cash received in highly liquid and secure investments, such as Central Bank accounts, sovereign bonds and reverse repos, as mandated under EMIR. In the event that the CCP fails to have sufficient liquidity to fund its obligations the CCP may have significant reputational and regulatory impacts which may further extend to the Group.
Capital Requirement Risk
Risk Identification and Description
Potential Impact on the Group Euronext N.V. as well as certain local entities, operate under strict regulatory requirements, which may include the maintenance of minimum capital requirements.
Management of regulatory capital is conducted in compliance with applicable regulation. Capital Requirements Regulation, MiFID II, Market Infrastructure Regulation (EMIR), CSDR, as well respectively applicable national requirements. There is a risk that Euronext N.V. or one of its regulated entities fails to comply with the applicable regulation and associated requirements for minimum capital held.
In the event that Euronext N.V. or its regulated subsidiaries do not have sufficient regulatory capital, the Group or the relevant subsidiary’s operating licences may be jeopardised, which would affect the Group’s capacity to operate its financial infrastructure, negatively impacting revenues, brand and reputation. -
2.2 Mitigation Measures
The measures described in this section are presented to provide additional information on the Group’s efforts to seek to manage the likelihood, frequency, or impact of certain risks. Despite the measures noted, the Group’s efforts may not be successful in limiting or preventing these risks from materialising or may not achieve the intended benefits, therefore risks in Section 2.1 - Risk Factors remain material risks for the Group. Refer to Section 2.1 - Risk Factors for a discussion of the Risk Factors that may negatively impact the Group.
The Group closely monitors its transformation programs, which include formal frameworks that establish governance bodies to organise, and implement its strategic projects. Governance instances are also developed horizontally across strategic projects to identify cross-dependencies, including delivery and internal and external readiness.
Group knowledge and expertise is continually increasing as the Group gains capacity, competence and experience in expanding its technology into the Group and delivering synergies. The Group has developed a strong project culture including management knowledge and oversight of projects, reinforcing the Group’s ability to complete projects within expected timelines.
Euronext actively monitors all relevant European and national legislative and regulatory policy developments and engages in regular discussions with issuers and trading members, European and national policy-makers, and regulators to provide input and respond to developments and consultations attempting to ensure an acceptable impact on our markets. Euronext is working to simplify and harmonise its regulatory process. However, Euronext remains subject to all applicable regulations and directives signed into law whether they be detrimental to Euronext’s business or not and may translate into an additional regulatory burden for the Group or its entities.
Euronext considers international institutions’ economic outlooks and analyst forecasts to assess the level of this risk. The Group has demonstrated the resilience of its business model (diverse asset classes, geographic regions and other sources of income), and is working to develop its non-volume related businesses to reduce the impacts of macroeconomic volatility.
The Group challenges its peers on their markets, in particular for the listing of global companies and SMEs in the technology sector. The Group has established a sales presence building proximity in several European locations. The Group identifies unlisted companies to support meeting their ambitions (additional financing) and maintains targeted pre-IPO programmes to familiarise key executives with financing solutions of capital markets.
Innovation in the equity sector and movements in the competitive landscape are closely monitored and actions are taken to protect market share and develop new offerings to attract trading. Euronext is focused on delivering the highest quality liquidity management with the aim of providing a deep pool of liquidity, best execution and a resilient market. The Group maintains, or improves its position by offering services, research and client engagement to respond to client needs. In particular, Euronet is expanding its pan-European and US equity offering for 2024 Euronext will implement new functionalities for the trading execution of institutional flow.
The Group clearing house competes for cash equity clearing flows, to maintain attractivity the Group seeks to generate decreased costs for clearing members for the clearing and settlement of instruments.
The Group makes significant efforts to mitigate cybersecurity risks, whether from threat actors or vulnerabilities, from materialising by making targeted investments in people, processes, and technology. The Group has a specific cybersecurity strategy, roadmap, and a Group-wide established governance model supported by dedicated resources. The roadmap and strategy are challenged by internal audits, external auditors and regulators from all countries where Euronext operates regulated markets. Euronext implements a security strategy and best practices aligned and certified in recognised global standards (e.g. ISO9001, ISO 27001, NIST) and seek to ensure a high level of cybersecurity maturity. Despite the Group’s efforts, cybersecurity threats continue to grow in sophistication and thus the risk cannot be eliminated.
The performance and availability of the Group’s systems are reviewed continuously and monitored to prevent problems when possible and responding, in a timely and efficient manner, when problems do occur. Euronext continuously invests in the development of its technology in order to maintain and ensure best in class service and capacity.
The Group has established governance instances to oversee multiple parallel IT programmes. This supports the objective of control of execution, proper resource allocation while maintaining system stability and continuity of service.
The Group seeks to identify and manage risks associated with third party supplier risk by partnering with reputable technology and services providers, via audits of the technology, backups and business continuity arrangements, as well as information on remediation plans should any of its providers experience service issues. The Aruba Data Centre is state-of-the-art Tier 4 data centre which ensures redundancies to avoid outages. The Group has implemented an Outsourcing Policy and a Procurement Policy which ensure the due diligence and contract review of all service providers to ensure that contracts are robust.
Euronext has contracts with each of its post-trade clearing providers that establish clear governance and service quality. Specifically, with LCH S.A. a long-term derivatives clearing contract has been signed between two entities and regular governance instances are established that maintains the relationship and ensures regular communication between the two entities. The derivatives clearing contract will be terminated following the migration of derivatives clearing to Euronext Clearing.
Following the change of default CCP for cash equity, Euronext Clearing, the Group’s CCP, has contractual relationships with the CSDs which provide settlement and custody services for Euronext Clearing, including the Group’s CSDs and Euroclear Bank. Such contracts include provisions to ensure the continuity of service. The Group interests are further protected at in Euroclear as the Group holds 3.5% stake of Euroclear S.A./N.V and is further represented on the Board of Directors.
The Group has process and controls in place to mitigate the impacts of unforeseen disruptions on its business activities. The Group has a strong group-wide Business Continuity Policy and programme, with mature governance instances in place. The Policy includes risk-based scenarios that support the assessment of the risk profile of the Group and its subsidiaries.
The Group maintains an ongoing process to assess its operational resilience and capacity to operate critical activities in the face of potential energy outages across its locations. The Group along with financial sector peers seek to ensure the well-being of their employees and continuity of their operations and to this end work to strengthen relationships with authorities to maintain security and resilience.
The federal model and geographic footprint enable Euronext to have a diversified talent pool and to allocate resources in areas with less competitive market conditions. It contributes to minimise impacts on business and operational resilience of the Group. Shared processes and HR systems are deployed across locations together with a common framework on talent acquisition, talent development, succession plans, performance management, compensation and career mobility.
To mitigate risk, the Group has established common Talent Develop practices across all locations, in accordance with the strategic plan priorities. A Group training plan, including leadership programs, and local training actions are in place to develop competencies of core strategic skills.
To help prevent a skill shortage, specifically in the information technology field, Euronext partners with engineering and IT schools to co-develop projects and improve its visibility as an attractive employer. The Group has an “Early Career” programme to recruit and train students and recent graduates with the latest technologies and critical skills. In addition, for more senior roles, Euronext has developed short term and long term international mobility to support teams upskilling and the federal model. In 2023, the Group continued to reinforce its ESG commitment internally and externally with initiatives to support its corporate purpose “Shaping capital markets for future generations”, including Climate session, Society projects, a diversity network across all locations and the launch of a Women Network in all locations. Health, sport, nutrition and work-life balance programs have been reinforced to support our employees.
In order to ensure that the Group remains compliant with all laws and regulations it has taken a range of proactive preventative measures. For example, the Regulatory and Government Affairs team of the Group monitors and informs the business about all relevant legislative developments, to ensure that business lines and operations are aware of all applicable rules and regulations. In addition, compliance policies and procedures are in place, regularly reviewed and supported by an annual training plan. The actions ensures Group entities and staff are compliant with applicable laws and regulations and uphold our corporate standards. The Euronext Code of Business Conduct and Ethics sets out the principles of behaviour required of all Company employees and is provided to all new joiners. In addition, conduct risk is primarily managed via a wide range of policies and procedures, applicable to employees, and is enforcing these through regular training and monitoring.
Legal and compliance functions have been established at various locations to ensure coverage of all business lines, including throughout all stages of business projects to comply with local laws and regulations.
The Group’s Treasury Investment Policy governs the credit risk requirements of counterparties (banks, financial institutions, funds) and their diversification to avoid a concentration of risk. Investments of cash and cash equivalents in bank current accounts and money market instruments, such as short-term fixed and floating rate interest deposits, are governed by a strict group Treasury Investment Policy aimed at reducing credit risk. The Group seeks to limit its exposure to credit risk by rigorously selecting the counterparties with whom it executes agreements. Credit risk created by derivatives for hedging purposes are negotiated with leading high-grade banks. The Group continuously monitors the credit ratings of its counterparties and reviews individual counterparty limits on a regular basis. Customers of the Group are typically leading highly rated financial institutions.
Credit risk at the Group’s power market is reduced by the margin/collateral posted by members, which is intended to exceed their expected daily trading. The Group’s power market adjusts its risk model parameters to take into account high volatility and prices to ensure sufficient levels of collateral in case of a member default. In certain circumstances, trading could potentially exceed collateral posted, however the entity closely monitors all members to prevent outstanding trading amounts in excess of collateral capacity. Key banking relationship assessed and considered low risk given high credit rating and systemic importance.
Risks associated with clearing activity are mitigated by a number of preventative controls and as well as measures that seek to reduce the impact should the risk materialise, the most important of which include:
■ Strict CCP membership rules including supervisory capital and operational capability ■ The maintenance of prudent levels of margin and default funds to cover exposures to participants. Members deposit margins are computed at least daily (including intraday calls), to cover the expected costs which the clearing service could incur in closing out open positions in a volatile market in the event of the member’s default. ■ Regular ‘Fire Drills’ are carried out to test the operational soundness of the CCP’s default management processes. All outstanding bonds maturing between 2025-2041 totalling €3 050 million are fixed-rate bonds not hedged. The Group seeks to protect capital by making short term investments in high quality and low risk financial instruments.
Foreign currency risk is reduced because the operating revenue and expenses in the various Group subsidiaries are generally denominated in the functional currency of each relevant subsidiary. The Group may use derivative instruments or foreign denominated debt to manage its net investment exposures. The Group is primarily exposed to major currencies, for which it is the Group’s policy not to hedge net investment exposures, cash flows paid or received at a currency different from the functional currency of the entity in question. While not typical, the Group may consider, on a case by case, hedging net investments and cash flows should circumstances dictate.
Margins and default funds collected from Clearing Members are sized to protect against latent market risk. The adequacy of margins is daily (also intraday) monitored and adjusted. Daily stress test based on ‘extreme but plausible’ scenarios encapsulating not only historical crises, but theoretical scenarios ensure that the Default Funds are sufficient to cover the most exposed banking groups. The CCP is compliant with the appropriate regulatory requirements regarding margin calculations, capital and default rules.
The CCP has a specific Investment Policy, compliant with EMIR Regulation. It defines the scope and the limits of potential investments to ensure that risk taking is limited and controlled. The Group’s CCP manages its exposure to credit and concentration risks arising from such investments by maintaining a diversified portfolio of high-quality liquid investments. The CCP monitors on an permanent basis, its portfolio and its compliance with the Investment Policy. Given the external environment, Euronext Clearing has adapted its strategy to risk-off to terminate any residual risk.
The Group’s policy is to maintain sufficient cash, cash equivalents and available bank facilities to enable the Group to repay its financial liabilities at all maturities, irrespective of incoming cash flows generated by operational activities. These assets are managed as a global treasury portfolio invested in non-speculative financial instruments, readily convertible to cash to ensure a high level of available liquidity.
The Group’s power market has committed risk capital, committed and uncommitted credit lines, trading is covered by collateral posted by members via pledged accounts, on-demand bank guarantees and letters of credit. Additionally the settlement cycle provides a buffer between inflow and outflows that further underpins liquidity. These measures have been established to help ensure that the entity has sufficient liquidity should it be required.
The Group’s CCP has implemented a regulatory compliant Liquidity Plan (regularly reviewed and shared with the CCP’s regulators head of submission to the CCP’s Board for approval) for day-to-day liquidity management and controls, including contingencies for stressed conditions. The Group’s CCP has multiple layers of defence against liquidity shortfalls including: minimum cash balances, access to contingent liquidity, and access to intraday central bank liquidity and secured and unsecured committed lines of credit. Investments over 2023 are, however, negligible almost all cash collateral is deposited at the Central Bank.
Euronext N.V. has a control and regulatory reporting framework with dedicated procedures aimed at ensuring the regular monitoring of the Capital Requirements for each of the regulated entities and that sufficient capital is constantly maintained within specific thresholds to meet the required levels under each of the regulations applicable to its subsidiaries.
-
2.3 Control Framework
Euronext is dedicated to building the leading European market infrastructure and powering capital markets to finance the real economy, while delivering value to shareholders. To execute our ambitions Euronext is committed to preserving a balance between pursuing our strategic ambitions and ensuring operational excellence. To support our ambitions and preserve favourable conditions to fulfil its mandate Euronext has adopted Enterprise Risk Management (ERM) framework and Internal Control frameworks.
The Enterprise Risk Management framework is designed and operated to identify potential events that may affect the Company, with the objective of protecting the Company. The ERM approach provides a framework to identify, assess, measure and manage risk to be within the defined risk appetite, via mitigation measures and control mechanisms, and monitor and report risks to protect the Group.
The Internal Control framework is designed to complement the ERM Framework. It seeks to support the Group in ensuring controls are robust, i.e. appropriately designed and implemented and correctly executed to support risk mitigation.
Corporate Compliance provides guidance with dedicated policies and standards to all Group staff, to establish and safeguard required and expected conduct in accordance with all applicable regulations and Group expectations.
Business Continuity Management (BCM) underpins Group operational resilience as it seeks to anticipate, respond and mitigate the impacts of potential incidents and crises to ensure the recover of critical processes and operational as quickly as possible in the event of a significant disruption.
Euronext embeds the risk and control awareness in the Company culture, to make risk and opportunity management a regular and everyday process for employees. The Supervisory and Managing Boards regard risk management and internal control as key management processes to steer Euronext, and enable management to effectively manage risks and opportunities.
Risk Management, Internal Control, Compliance and Business Continuity Management teams work closely to support and protect Group value, assets, and reputation.
The objectives and principles for the ERM process are set forth in the Group’s ERM Policy. The ERM process is based on industry best practice of both Internal Control and Enterprise Risk Management. It employs a bottom-up and top-down process to enable better management and transparency of risks and opportunities. At the top, the Supervisory Board and Managing Board discuss major risks and opportunities, related risk responses and controls and opportunity capture, as well as the status of the Group risk profile, including significant changes and planned improvements. The design of the Group risk management process seeks to ensure compliance with applicable laws and regulations with respect to internal control and risk management, addressing both subjects in parallel.
The ERM framework and governance is designed to allow the Managing Board and the Supervisory Board, as part of Euronext’s business model (see Section 1.3.1 - Business Overview of this Document for information), to identify and assess the Company’s principal risks to enable strong decision-making to execute Group strategy. Reporting is made and consolidated on a regular basis to support this process. The risk management framework further enables the Supervisory and Managing Boards to maintain and attest to the effectiveness of the systems of internal control and risk management as set out in the Dutch Corporate Governance Code.
■ The Supervisory Board validates the risk appetite, reviews risk management and internal control systems, and assesses their effectiveness via the Risk Committee. ■ The Managing Board is responsible for the suitable design and sustainable implementation of enterprise risk management (ERM) and internal control systems across the Group. ■ By delegation, the Risk Committee of the Managing Board (‘Risk Committee of MB’ or ‘RCMB’) oversees that the RM Policy and the RM Framework is applied, discusses key risks and potential actions, and challenges the RM Process. It defines and applies the risk appetite of the Group. The RCMB is composed of a subsection of the Managing Board. ■ Boards of subsidiaries, if constituted, ensure that the RM Policy and the RM Framework is appropriate to the specific circumstances of the entity and serves the governance and regulatory requirements of that entity. ■ The Group’s CFO has primary responsibility for the controls over financial reporting and regulatory capital requirements. ■ The Group’s CISO has primary responsibility for the controls over cyber and information security. ■ The senior management of the Company assume responsibility for the operation and monitoring of the ERM system in their respective areas of responsibility, including appropriate responses to reduce the probability and impact of risk exposures and increase the probability and impact of opportunities. ■ The Head of Risk and Compliance is appointed by the Managing Board, reports to the Chief Executive Officer and has a line of communication to the Risk Committee of the Supervisory Board. This reporting structure provides the necessary independence second line of defence teams. The Group Head of Risk and Compliance has primary responsibility for the ERM strategy, priorities, process design, culture development and related tools; the risk management organisation is structured cross-division, as a network of risk owners permitting the coverage of the entire Group and drives a proactive risk management culture.
Risk and Compliance officers are located in countries where Euronext conducts its activities and are supported as necessary by local legal staff to benefit from the local expertise and knowledge of the local business and environment.
Euronext’s internal risk management and control is a process executed by the Managing Board, management and other employee stakeholders. It is designed to provide reasonable assurance regarding the achievement of objectives in the following categories:
No major failings were identified by the Risk and Internal Control Programmes over the course of 2023.
As Euronext continuously evolves its internal control programme and related oversight, it will continue to challenge first line controls and ensure the Internal Control testing plan is risk-based and adapted to oversee critical processes.
Euronext’s first and second lines of defence perform their roles in risk assessment and reporting on risk management and control systems. The results are reported in the Risk Profile and discussed regularly at Managing Board meetings and with the Supervisory Board via the Risk Committee of the Supervisory Board.
Internal Audit, as the third line of defence, provides an independent and objective assurance on the organisation’s governance, risk management and internal control as well as the operational robustness of processes. Internal Audit reports are discussed with risk and process owners. The Head of Internal Audit attends Managing Board meetings on a regular basis to discuss its findings and recommendations. (See Section - 2.3.3 Third Line of Defence of this Document for more information).
2.3.1 FIRST LINE OF DEFENCE
The First Line of Defence, represented by the department risk owner is accountable and has the authority to manage risk.
The first line identifies, notifies, assesses, and manages/mitigates risks within their relevant scope in coordination with the Second Line of Defence. Furthermore, the First Line of Defence cascades the risk appetite throughout their scope, monitors risk and validates risk-related information.
The first line is accountable for maintaining accurate information regarding the action plans related to identified risks. The progress and effectiveness of action plans (as well as the implemented risk mitigation measures) is monitored by the relevant risk owners and, regularly and/or upon request by the second line of defence.
-
3 EMPOWER SUSTAINABLE FINANCE |DR|
3.1 Value Creation by Euronext
The purpose of every responsible company is to create sustainable value for shareholders and stakeholders. The Euronext Value creation model has been developed according to the International Integrated Reporting (IIRC) Framework. It shows how the company uses the resources, capabilities and expertise at its disposal to create value. The model transforms the different capital inputs into value outputs and impacts that over the short, medium and long-term create value for the company, its stakeholders and society at large.
Euronext’s inputs are financial, intellectual, human, social and natural. With these inputs Euronext brings value to its different stakeholders by connecting local economies to global markets, accelerating innovation and sustainable growth. Euronext gives companies access to capital either through initial public offerings (IPOs), capital increases or through the debt route. It allows investors to get returns either by way of capital appreciation (growth) or timely income (dividends). It facilitates not only domestic investments, but also brings in foreign capital which is used for further development and growth. It also promotes an environment that encourages collaborative work, learning and innovation for all its employees. In a more long term approach, Euronext has linked its business model with the globally agreed Sustainable Development Goals (SDGs) on which its impact is the most important.
The world is facing significant challenges in ensuring a sustainable future for its people and its planet.
The finance sector is an important contributor to the global sustainability agenda and should promote sustainable finance, by incorporating environmental, social and governance (ESG) factors into investment decision-making, and by supporting the allocation of capital to sustainable initiatives.
Every organisation has a unique role to play in the transition to a sustainable society, based on its impacts, risks and opportunities. With a special position in the financial ecosystem, Euronext connects European economies to global capital markets, to accelerate innovation and sustainable growth, with the ambition to build the leading market infrastructure in Europe and the purpose to shape capital markets for future generations.
The strategic plan “Growth for Impact 2024” is built on Euronext’s strong focus on ESG, with the priority to empower sustainable finance through an ambitious 1.5° climate commitment for Euronext that aims to make a tangible impact on its partners and clients, and an enhanced inclusive people strategy. The sustainability strategy focuses on accelerating climate action both in Euronext’s operations and through the role it plays in empowering sustainable finance across all its markets.
■ driving investment in innovative, sustainable products and services through secure and transparent markets, in continuous collaboration with the financial community; ■ inspiring and promoting sustainable tangible practices within the company and towards its communities, by respecting and developing its people and by supporting its ecosystem. In 2018 and 2019, as a first step towards the creation of its ESG strategy, Euronext realised a stakeholder consultation to identify the ESG related issues that its stakeholders believed to be the most important areas of focus and effort for the Group. Euronext received feedback through workshops and interviews from a wide selection of stakeholders, notably investors, analysts and issuers, but also employees and regulators, all providing valuable insights.
On the basis of these results, Euronext performed a materiality analysis, defining eleven key issues in which Euronext could be most impactful, and that influence most stakeholder decision-making. These were grouped into 5 material impact areas, consistent with the Euronext dual ESG ambition.
The stakeholders were invited to prioritise the eleven key issues - labelled under the five material impact areas - and the results are illustrated in the chart below. Specific KPIs have also been defined for each impact area, details of which are set out in the sections below, with a summary in section 3.5 - Summary of ESG KPI.
Key Issues Material Impact
AreaDrivers of the Mission Fit for 1.5° KPI ■ Organise a trusted, fair, transparent and efficient market, thereby enhancing access to capital.
■ Promote and develop sustainable and innovative products and services with environmental (green and blue) or social added value.
Our Markets Driving investment in innovative, sustainable products and services through secure and transparent markets, in continous collaboration with the financial community. Develop capital market solutions for a carbon neutral European economy. ■ Number of incidents reported to the College of Regulators.
■ Number of operational alerts treated internally by EMS.
■ Availability of the trading platform.
■ Percentage of ESG Revenues.
■ Be the spokesperson of the sector and foster “Issuer-Investor” dialogue.
■ Maintain an ongoing dialogue with multi-stakeholder partnerships.
■ Educate our partners on financial literacy and regulationsx.
Our Partners ■ Percentage of suppliers with SBTi set reduction targets on Scope 1 and Scope 2 GHG emissions
■ Client satisfaction (“NPS”).
■ Develop skills and retain talents in an open culture of dialogue.
■ Promote diversity.
■ Respect human rights and local labor laws.
Our People Inspiring and promoting sustainable tangible practices within the Company and towards our communities, by respecting and developing our people and by supporting our ecosystem. Implement a forward-looking and outcome-based approach across all its impact areas, including human capital, community investment and governance issues that are material to its industry with a view to improving its overall ESG ratings relative to peers. ■ Diversity at the Senior Leadership Team. ■ Act ethically, with integrity and the highest standards in terms of good governance.
■ Educate and engage with our local Community.
Our Society ■ GDPR training employees.
■ Personal data breaches.
■ Use of the Whistleblowing process.
■ Reduce our own carbon footprint and contribute to the protection of the environment. Our Environment Commit to setting science-based quantitative climate targets by signing the “Business Ambition for 1.5°C” ■ Carbon emission. Euronext’s 11 material topics, categorised under the five material impact areas, have been organised on a matrix to visually represent the results in terms of their importance to stakeholders and the significance of their ESG impact.
In addition, in 2023, Euronext launched a new stakeholder engagement initiative to conduct a double materiality assessment making use of the Corporate Sustainability Reporting Directive (CSRD)1, that entered into force as of 5 January 2023, and of the final European Sustainability Reporting Standards (ESRS)2 as adopted by the European Commission on 31 July 2023.
As part of the double materiality assessment process, Euronext has considered both the impact materiality and financial materiality perspectives:
■ Impact materiality reflects the inside-out perspective: Euronext’s actual or potential, positive, or negative impacts on people and the environment. ■ Financial materiality reflects the outside-in perspective: the potential effects of sustainability-related risks or opportunities on Euronext’s financial position, performance, and cash flows over the short-, medium- and long-term. The double materiality assessment resulted in the identification of 9 material topics for Euronext, which are illustrated in the table below. The table is complemented with a high-level explanation of the changes in current material topics.
In this context, Euronext considered whether it would be seen as a facilitator for certain companies by providing them access to capital and financing their activities, and thereby enabling the positive or negative ESG impact of these companies. Based on the stakeholder engagement, it has been concluded that it was not the case. The core business of Euronext is to organise trusted and transparent markets, bringing together buyers and sellers. The impact attributable to Euronext which is highly regulated would be low since Euronext is only providing the infrastructure and Euronext’s impact on downstream customers is mainly economic. For example, Euronext cannot implement stricter requirements on ESG for new companies which want to be listed on its markets.
1 Directive (EU) 2022/2464 of the European Parliament and of the Council of 14 December 2022 amending Regulation (EU) No 537/2014, Directive 2004/109/EC, Directive 2006/43/EC and Directive 2013/34/EU, as regards corporate sustainability reporting (Text with EEA relevance)
2 Commission Delegated Regulation (EU)2023/2772 of 31 July 2023 supplementing Directive 2013/34/EU of the European Parliament and of the Council as regards sustainability reporting standards
The process and outcomes of the double materiality assessment have been reviewed and approved by the Euronext’s Managing Board.
A process is ongoing to analyse the current gaps to be aligned with the CSRD and the ESRS requirements. As such, this 2023 report has been prepared in accordance with the Non-Financial Reporting Directive (NFRD). Euronext has proactively incorporated certain requirements of the ESRS when the data was available. However, Euronext will achieve full alignment with the CSRD for the reporting year 2024.
Material topics NFRD Change in material topics Material Topics identified
through the DMA Process■ Reduce CO2 More broadly defined in line with ESRS, covering climate change mitigation, climate change adaptation and energy. ■ Climate Change (Fit for 1.5°)
■ Promote diversity Additionally, it will incorporate the importance of creating an inclusive environment. ■ Diversity and Inclusion ■ Develop skills and retain talents in an open culture of dialogue While maintaining the main topic, it will be split into various material ESRS sub-topics. ■ Working conditions
■ Training and Development
■ Trusted markets Will no more be included as a separate topic since it’s not considered as a sustainability matter as defined under CSRD. However this topic can be partially linked with “Corruption and Bribery” through the need to ensure the security of the markets, which is a material ESRS topic. ■ Corruption and Bribery ■ Act Ethically More broadly defined to promoting ethical behaviour. It recognizes that act ethically is not solely dependent on individual actions, but is influenced by the overall culture and governance practices within Euronext. ■ Culture and Governance ■ Engage locally Considering the business activities of Euronext and the definition of the ESRS, it has been concluded that local communities are not among Euronext’s key stakeholders. Therefore this topic will not be included in the list of material topics. N/A ■ Ongoing dialogue “Ongoing dialogue” was about maintaining a dialogue with multi-stakeholder partnerships. This can be partially linked with management of relationship with suppliers which will be a specific material ESRS topic. ■ Management of relationships with suppliers ■ Spokesperson “Be the spokesperson of the sector” and foster “Issuer-Investor” dialogue has a link with “Political Engagement”, which will be a material ESRS sub-topic. ■ Political Engagement ■ Sustainable products
■ Educate
“Sustainable products” will be maintained as a separate entity specific topic, and will be combined with the “Educate” topic, as it is about educating clients/suppliers/partners on financial literacy. ■ Sustainable Products and Services, including trainings ■ Human Rights This topic will be maintained, but split in various material ESRS sub-topics. ■ Working conditions
■ Diversity and Inclusion
-
3.2 ESG Governance
Euronext has a two-tier governance structure in accordance with Dutch law, composed of a Managing Board and a Supervisory Board. The Managing Board is responsible for developing and implementing the Company’s strategy, as well as assuring the day-to-day operations, and is composed of executive directors. The Managing Board is supervised by the Supervisory Board composed of non-executive directors, the majority of whom is independent, including the Chair. The Supervisory Board is responsible for the supervision of the policy of the Managing Board and the general course of affairs in the company and the business affiliated with it and for advising the Managing Board. Key decisions require the approval of the Supervisory Board. The Supervisory Board has four different committees (nomination and governance, audit, risk, and remuneration). Each of them has a role to play in the sustainable journey of the group. This is explicitly laid down in the charters of the committees.
Both, the Supervisory Board and the Management Board, have fully endorsed ESG as core of the “Growth for Impact 2024” strategic plan of Euronext.
With the help of the Group Head of ESG, the General Counsel, part of the Group’s Extended Managing Board and the Executive Committee, is in charge of coordinating ESG at the Group level, making sure that all relevant departments integrate the ESG objectives into their missions. The General Counsel ensures that ESG initiatives, impacts and challenges are high on the agenda of the Group’s Managing Board and Supervisory Board, and that the company reports on ESG related topics in a transparent way. In 2023, members of the Supervisory Board have been regularly trained on ESG topics, including diversity and inclusion and sustainable long-term value creation, to make sure they understand and embrace these new challenges, as well as the consequences of the ongoing climate crisis.
A strong dedicated governance, structured around the five material impact areas described above and headed by the Group Head of ESG, ensures suitable coverage of all priority topics.
Moreover, a dedicated project governance has been put in place for the Environmental pillar, to mobilize all the internal actors and facilitate the implementation of an integrated approach to ensure that the carbon reduction targets are reached.
Additionally, a dedicated project governance has been established to ensure a sustainable value chain. This involves engaging internal stakeholders from various departments, including procurement, ESG, legal, and communication. The primary objective is to strengthen supplier engagement and foster a solid commitment to sustainability. Furthermore, this initiative aligns with the attainment of Euronext’s SBTi targets especially the one related to supplier engagement.
Finally, all ESG initiatives are captured by the Transformation Office, which monitors the progress of the whole strategic plan of the Group, reports regularly on these progresses to the Managing Board and the Supervisory Board and, in this context, has regular update meetings with the Group Head of ESG. All significant new ESG related projects are submitted for approval to the Managing Board.
-
3.3 Relevant ratings and standards
Unless specified otherwise in section 3.5., Euronext aims to include all the entities that are in the scope for financial information in this chapter 3.
3.3.1. ESG ratings
Euronext recognizes the critical role of ESG rating agencies in providing accurate and transparent information to the market, and considers the engagement with these actors as a central element of its ESG strategy.
Euronext monitors the ESG ratings very closely and conducts gap analysis regularly on scores to identify areas of development. Euronext’s ESG scores improved across multiples rating agencies in 2023, reflecting the Group’s commitment to provide its stakeholders with timely and transparent ESG reporting. An excellent example of this progress is the transition from a D rating to a B rating in CDP, also highlighting the significance that Euronext places on addressing climate-related issues.
-
3.4 Euronext’s five ESG impact areas and the sustainable development goals
In this section, Euronext provides an overview of the progress made in 2023 against the 11 key ESG issues, supporting Euronext’s 5 material impact areas.
3.4.1. Our Markets
■ Organise a trusted, fair, transparent and efficient market, thereby enhancing access to capital ■ Promote and develop sustainable and innovative products and services with environmental (green and blue) or social added value In its recent double materiality assessment (see Section 3.1. - Value creation by Euronext), Euronext has identified Corruption and Bribery and Sustainable Products and Services, including trainings, as material ESG topics. Reporting in line with the new material topics will occur in 2024, when Euronext is to be aligned with the CSRD.
As an operator of regulated markets, Euronext’s mission is to bring together buyers and sellers in trading venues that are transparent, efficient and reliable.
■ Adopts rules for each of its markets to ensure fair and orderly trading and efficient order execution; ■ Sets up a framework to organise market monitoring by which it oversees trading in order to identify potential breaches of the rules, disorderly trading conditions or conduct that may involve market abuse; ■ Offers state of the art, reliable, scalable and resilient technology with a large range of functionalities to market participants to allow trading even in times of high volumes. A particular attention is paid at cybersecurity and data protection; ■ Reports breaches of rules or of legal obligations relating to market integrity to the competent authority. Market surveillance and monitoring are implemented through a two-step process consisting of real-time market surveillance and post-trade (i.e., “next day”) analysis of executed trades. Euronext ensures member compliance with its rules by conducting on-site investigations and inspections; ■ Invests in technology aiming to improve its monitoring. Part of Euronext’s role in maintaining trusted, fair and orderly markets includes ensuring the security of those markets. The growth in the digitalisation of the finance industry over the last years has revolutionised the sector. This transformation means that an increasing number of financial services are becoming available to more and more people at an ever increasing pace. Euronext has grown and continues to thrive with these changes via increased volumes and processing power enabling the Group to grow in complexity and size. With increased complexity, size and access come potential cyber security risks. Euronext has, through cyber security governance and management, implemented a programme that guarantees the necessary security controls in place in order to protect its markets from unwanted activity.
Euronext management has a strong commitment to upholding the security of the group. Management oversees the information security/cybersecurity strategy and review process as well as annual plans, ensuring that the programme stays current with the evolving environment and to avoid and treat potential negative impacts to Euronext. For further information of cybersecurity risks please refer to section 2.1 - Risk Factors of this Universal Registration Document.
Number of serious incidents (severity 1 and 2) on the regulated markets reported to the College of Regulators (KPI n°1):
The Euronext Market Services (EMS) team, also the front line to ensure fair and orderly markets for all Cash, Derivatives and Commodities products, including Corporate Actions, Euronext Indices, Euronext Market Data, Member on boarding and Hosted Commercial Markets. In this context, the EMS team has the ownership of the serious incidents process and ensures that it is fully assessed, graded and efficiently managed.
■ Facilitate restoration of normal service operations as quickly as possible, and minimise the adverse impact on business operations, thus ensuring that the best possible levels of service quality and availability are maintained; ■ Ensure that serious incident management and resolution is performed in an effective and controlled manner in compliance with best practices and the organisation’s internal and external rules and regulations; ■ Ensure all customers, clearing houses and regulators are alerted in a timely manner on the market status and are kept informed during the incident; ■ Ensure that all relevant stakeholders within EMS and IT are directly updated on the status of recovery activities until service is fully restored; ■ Ensure that all relevant stakeholders within EMS and IT are informed of the outcomes of post-incident investigations and the actions being taken to avoid a recurrence. This KPI covers all the markets operated on the Optiq® trading platform, including Borsa Italiana from the date of the migration of the Italian markets on the Optiq® platform. This migration has taken place in different steps:
■ The migration of Equities and ETF in March 2023, so the scope of KPIs after March 2023 includes Borsa Italiana in those two segments of Optiq®; ■ The migration of Warrants and Fixed Income in September 2023, so the scope of KPIs after September includes BITA in 4 different segments of Optiq®”. The number of incidents reported to the College of regulators in 2023 is 5, including 1 of Severity 1.
Number of operational alerts treated internally by EMS: Euronext has an alerting mechanism in place (KPI n°2):
The EMS team has also access to all relevant EMS Cash and Derivatives business and technical monitoring tools and operates daily from 06:30-22:30 CET.
The alerts are triggered real-time and help the operational teams of EMS to secure a smooth running of the markets. The type or the scope of alerts may change over time.
On the Euronext regulated cash markets, 52,936 alerts were treated by EMS compared to 59,719 in 2022, 47,995 in 2021 and 99,409 in 2020. Euronext observed a decrease of 11%. Overall, the result is in line with recent years.
This KPI covers all the markets operated on the Optiq® trading platform, including Borsa Italiana from the date of the migration of the Italian cash markets on the Optiq® platform. The number of alerts on the Italian cash markets subsequent to the migrations on the Optiq platform is 38,974. The migration of the cash market has taken place in different steps (see above for further details).
On the Euronext regulated derivatives markets, 185,677 alerts were treated by EMS in 2023, compared to 505,522 in 2022, 458,626 in 2021, and 1,195,733 in 2020. Euronext observed a decrease of 63% which is in line with the market activity and the market volatility. The EMS team has also successfully reduced the number of false positive alerts by reducing the number of alerts for situations where no action was required.
For the previous years, the increase in volatility, as the result of the conflict in Ukraine and the Covid situation, had a significant upwards impact. The KPI does not cover the Italian derivatives markets since this market has not migrated yet on the Optiq® platform.
This KPI covers as well all the markets operated on the Optiq® trading platform, including Borsa Italiana from the date of the migration of the Italian cash markets on the Optiq® platform.
3.4.1.2 Promote and develop sustainable and innovative products and services with environmental (green and blue) or social added value
With its strategic plan “Growth for Impact 2024”, Euronext is focussing on accelerating climate action to accelerate the transition to a European economy aligned with a 1.5° trajectory. This will help drive investments towards decarbonised assets and support Euronext’s clients on their ESG journey. A key part of this strategy is to expand the Group’s ESG business and continue its growth in this area.
The EU Taxonomy does not apply directly to Euronext’s activities and it is not therefore the best framework for classifying its products and services as sustainable. Euronext therefore worked on its own definition of ESG revenues and does measure the ESG revenue according to this definition, which is described in more detail in Section 3.5.- Summary of ESG KPI’s.
In order to assess the growth of its ESG business, Euronext has put a specific KPI in place which consists of calculating the percentage of revenues attached to those ESG products and services, compared to its overall revenues (KPI n°4), with a clear ambition to increase that KPI.
After further analysis, the scope of the KPI has been extended compared to 2022, and now also includes the revenues generated from the initiative “Sustainable finance partnership” for which partners are provided with the «Borsa Italiana - Sustainable Finance Partner» Label (see section 3.5 for a full list of ESG products and services). Figures of 2022 have been reviewed with the same scope as for 2023, resulting in a non-material adjustment.
Even if the 2023 percentage remains stable, ESG revenues have increased from €65.4 million to €69.9 million, i.e. by +6.9% compared to a +3.9% increase in overall revenues.
Euronext ESG Indices are designed to support common approaches to environmental, social and governance (ESG) investing. They are based on fully transparent and rules-based selection process whose methodologies measures risk and performance across a variety of ESG areas.
In 2023, Euronext launched 18 new ESG indices, including the CAC 40 SBT 1.5, the Eurozone SBT 1.5, the Europe SBT 1.5, the Biodiversity Enablers world, and the Biodiversity screened world. At the end of the year, there were more than 300 listed structured products for the French market alone linked to Euronext ESG indices. These had a combined assets under management of almost €9 billion7.
Moreover, Euronext is one of the leading ESG index providers in Europe for structured products since 2019, according to the independent SRP database.
ESG Exchange-Traded Funds (ETFs) represent a significant stride in the asset management world. As such, ESG ETFs, are rapidly gaining popularity, reflecting a broader shift in the investment community towards sustainability and corporate responsibility.
Currently there are 1,011 ESG-related ETFs available on Euronext markets, complying with the EU’s Sustainable Finance Disclosure Regulation (SFDR), whereof 892 fall under art. 8 of the SFDR and 119 under art. 9.
Euronext SFDR categorisation under SFDR for ETF is available on the Euronext website from January 2023. It provides analytics and statistics to all interested parties.
Sustainable Investing is an important theme in Euronext’s investment funds market. In 2023, 12 additional sustainable fund securities were listed on Euronext.
There are currently 125 ESG-related investment funds listed and traded on Euronext, and 90% of them are ESG investment funds: 113 funds among which 80 are “SFDR-article 8” and 45 are “SFDR-article 9”.
Euronext is the leading venue for ESG bonds, with more than 2,200 green, social, sustainability and sustainability-linked bond listed and admitted to trading on its markets, from 500+ issuers and accounting for more than 1.3 trillion euros.
In 2023, debt capital markets recovered from a 2022 bleak year. Higher issuance volumes were generated by European corporates, benefiting Euronext.
Sustainable bonds also enjoyed a strong revival, with the Euronext ESG Bond Platform welcoming 71 new ESG issuers. Close to 500 ESG bonds were listed on the platform in 2023, compared to 400 in 2022. Euronext is now the world leading venue for the listing of ESG bonds.
Euronext is committed to give more visibility to its ESG Bonds issuers and to participate in the development of the overall sustainable bond market. It did so by publishing 4 ESG Bond Barometers, with 8 interviews with green leaders.
The best-in-class section of SBTi climate-aligned ESG bond issuers is also very active and has been extended to companies with a validated Net Zero pathway (in addition to companies having a validated 1.5° pathway). 16 companies joined this section in 2023.
Finally, Euronext organized, in September, five inaugural DCM committees in Dublin, Paris, Oslo, Amsterdam and Brussels, gathering industry experts, to discuss ESG trends and topics.
Euronext launched in 2022 a future on the CAC 40 ESG Index to support the development of responsible investments, and expansion of its ESG derivatives offering.
This launch aims for the ongoing reallocation of assets from the CAC 40 index to its ESG version, by enabling market participants to manage and hedge ESG portfolios efficiently and in compliance with ESG principles, and to lower the cost of trading.
Euronext is committed to encourage the incorporation of ESG factors into investment decision-making and supports equity issuers in their ESG journey. Such commitment is materialised in the ESG Reporting Guide which is designed to help listed companies understand how to address ESG issues in their interactions with investors and the wider ESG community, and the main principles to consider when preparing an ESG report.
In 2023, Euronext published a new guide targeted at pre-IPO companies, in collaboration with the Paris Institute for Sustainable Finance. It provides a set of recommendations on best practices for ESG during the IPO process, as well as an overview of investor expectations on corporates’ ESG maturity.
Euronext also announced the strengthening of the ESG contents in its educational pre-IPO programme IPOready.
From 4 to 8 September 2023, Euronext organised its first Euronext Sustainability Week, an entire week of activities dedicated to sustainable finance. Originally launched as Italian Sustainability Week in 2017, Euronext has expanded this successful concept to encompass all its geographies across Europe. Around 40 external and internal events, combining conferences, workshops, and webinars, were held over five days, from nine different geographies across Europe and targeting corporate and investors audiences, to foster sustainable finance.
The event aims to provide a concrete response to the need of issuers and investors to benefit from educational moments and dialogue. Companies attending the event have the opportunity to discuss with domestic and international institutional investors about their sustainability strategies through one-to-one meetings.
With the launch of My ESG Profile, Euronext has become the first stock exchange to make the ESG data of its issuers available in a standardized format on its website. In November 2023, Euronext published close to 1,900 company ESG profiles containing over 60,000 data points on Euronext Live. Data is collected and validated by a specialised data partner directly from issuers’ annual reports based on a list of thirty quantitative indicators sourced from key European regulations. The objective of My ESG Profile is to support the transition to a sustainable economy, by providing listed companies with a digital tool they can use to centralise relevant ESG information, showcasing their sustainability efforts to the market, while facilitating investors’ access to this key data to inform their sustainable investment decisions.
The launch of this service marks an important milestone in Euronext’s ambition to provide concrete tools and guidance on ESG to all its listed companies, while facilitating investor-issuer dialogue on ESG matters.
ELITE is an international network of SMEs that connects companies with diverse sources of capital to drive their growth. Sustainability and Corporate Governance are two of the pillars on which companies can get access to training, guidelines, recognition of achievements and a pool of partners/advisors to execute development projects. In particular, the ELITE membership includes:
■ Training modules and vertical workshops on Corporate Governance: how to build a Board of Directors in SMEs; the role of Corporate Governance in strategic management and the relationship between owners and management. ■ Guidelines on Corporate Governance on the best practices in order to achieve long term success for their stakeholders and Governance Certificate that is recognised to those companies in line with industry standards. ■ International workshops on Sustainability as an occasion to connect with experts and top decision makers from EU institutions, academics, large corporates and industry advisors. ■ Company assessment on Sustainability with specific focus on voluntary SMEs sustainability reporting and introduction to partners to support on sustainability projects. Corporate Services is a fully-owned subsidiary of the Euronext Group helping listed companies to make the most effective use of capital markets and supporting organisations with innovative solutions and tailor-made advisory services in Governance (iBabs), Compliance (ComplyLog), Communication (Company Webcast) and Investor Relations (Advisory and IR Solutions). Corporate Services already serves more than 4,800 clients in over 30 countries, of which 1,000+ are listed companies.
■ iBabs enables a significant reduction of paper consumption through paperless and digital meetings management solutions which supports the adoption of best practices in terms of good Corporate Governance and enables a more collaborative, secured, efficient and informed decision-making process within Board of Directors and Executive Committees. ■ IntegrityLog helps companies to ensure a transparent and ethical governance through a dedicated whistleblowing tool. ■ InsiderLog automates the management of inside information and insider lists for both issuers and their professional advisors and therefore compliance with EU Market Abuse Regulation (MAR). ■ Company Webcast, market leader in webcast and webinar solutions, reduces the negative environmental impacts of transportation through remote and digital conferences, while making sure that companies deliver regular communication. ■ Advisory and investor relations (IR) Solutions, supports listed companies to meet ESG requirements in a context of increasing compliance and transparency requirement, growing involvement of shareholders in Corporate Governance, and pressure from rating agencies on companies. This support consists in several offers, namely: ■ The “Shareholder Analysis” offer allows issuers to have a clearer understanding of the shareholding structure, proactive communication and rationalised targeting of investors. ■ “ESG Advisory” assists companies in understanding of investors’ expectations and in building a comprehensive tailor-made ESG strategy by evaluating non-financial issues, providing ESG perception studies, prioritising and collecting data to engage with investors. Through commercial partnerships, “ESG Advisory” offer comes with (i) a reporting solution to facilitate the collection, reliability, consolidation and analysis of corporate ESG data and (ii) governance analytics and board assessments. Euronext Securities offer Shareholder Register Services that provide insight on companies’ shareholders. They have a range of solutions, including daily updated digital shareholder registers in Norway and Denmark, periodically updated shareholder registers in Italy, and shareholder identification solutions in Portugal, that is provided to issuers. These services help companies identify shareholders, enabling them to engage with and support their ESG goals.
Euronext Securities General Meeting Services are tailored to support the ESG goals of the clients. This include a significant component, the Virtual General Meetings (VGM), which allows shareholders to participate in general meetings remotely. This feature not only diminishes the necessity for travel, reducing the associated carbon footprint, but also enhances shareholder accessibility and engagement. In addition to VGM, Euronext Securities offers a range of solutions to digitize various processes involved in general meetings. These solutions help in cutting down the consumption of paper and other resources, aligning with sustainable practices. By offering and investing in both virtual and traditional general meeting services, Euronext Securities demonstrates a comprehensive commitment to supporting the ESG objectives of their clients.
SDG Targets Quantitative results Qualitative achievements 
Build resilient infrastructure, promote inclusive and sustainable industrialization, and foster innovation.
As a stock exchange Euronext can contribute to the increase of access of small-scale industrial and other enterprises, to financial services.
Elite
New companies who joined ELITE in 2023: +157 across Europe.
Total number of events: 43 training and workshop events for a total cumulated of 64 days of duration - of which 12 full days on ESG related topics (governance, DE&I, sustainability) and 8 online webinars.
Euronext securities
Number of General meetings that were supported by Euronext:
■ Norway: 325 (299 in 2022);
■ Denmark: 273 (200+ in 2022);
■ Italy: 257 (242 in 2022).
Elite
All companies access to a specific and mandatory module entirely dedicated to Corporate Governance.
ESG Indices
■ First Euronext Employment indices with the Euronext French Employment 40 which selects the 40 companies from the SBF120 with the highest Humpact score.
■ First Euronext Gender Equality indices launched, in partnership with Equileap. The Euronext Equileap Gender Equality France 40 and the Euronext Equileap Gender Equality Eurozone 100.

Ensure sustainable consumption and production patterns.
ESG indices, derivatives and ETFs create a use-case for ESG information and an incentive for issuers to improve their ESG practices: Euronext’s ESG guidance disseminates ESG disclosure best practice. By facilitating issuer-investor dialogue on ESG matters, Euronext strengthens the business case for ESG practices and disclosure.
ESG reporting guide
■ 854 downloads in 2023;
■ 2306 downloads in total since its publication.
ESG ETFs
159 new ESG-related ETF available in 2023.
ESG Funds
125 ESG-related investments funds listed and traded on Euronext.
ESG derivatives
Launch of the Euronext CAC 40 ESG index future.
ESG Bonds
Euronext is the world leader in green bonds (in terms of number of green bonds, in terms of number of issuers and in terms of AUM).

Take urgent action to combat climate change and its impacts.
As a stock exchange, Euronext can play a leading role in creating climate resilient markets by offering related financial products as well as by encouraging or requiring climate disclosure in this area?
Green bonds
■ Green bonds represents 55% of the Euronext ESG bond offer;
■ €292 billion raised by ESG bonds in 2023.
ESG Bonds
Creation of a best-in-class section promoting ESG bond issuers that have a SBTi-validated 1.5° strategy: the SBTi 1.5° ESG Bonds Issuers. 43 issuers are displayed on this section.
ESG indices
Euronext Biodiversity Screened World Index and Euronex Biodiversity Enablers World Index launched in August 2023.
In 2023, Euronext was awarded “Best Pan-European Index Provider 2023” as well as the “Excellence Award for Robust Biodiversity Solutions 2023” at the Ethical Finance Awards. The Euronext Euro Large Cap Biodiversity Leaders 30 index won the “Best Index of the year” SRP award.
Publication of a revised version of the ESG Reporting guide with a focus on the 1.5°C global temperature increase trajectory.

Conserve and sustainably use the oceans, seas and marine resources for sustainable development.
Water-themed ESG indices create an incentive for upgrading issuers’ water-related practices: As an exchange, we enable companies active in the blue economy to raise capital.
The last years, 35 new Blue Economy companies listed in Euronext markets (an increase of 30% over 2015).
Over the 5 year period from 2015 to 2019, these companies:
■ Grew revenue at an annual growth rate of 4.5%;
■ Grew EBITDA at 13.3%;
■ Grew employment at 3.2%
Water Indices
Financial ESG indices developed by Euronext with a thematic focus on water include:
■ Euronext Water and Ocean Europe 40 EW (launched in 2021);
■ Euronext CDP Water Eurozone EW (launched in 2020).
-
3.5 Summary of ESG KPI
2023 2022 2021 2020 2019 Serious Incidents reported to the College of Regulators 5 7 6 14 11 2. Number of operational alerts treated by EMS Number of operational alerts 2023 2022 2021 2020 2019 Euronext cash regulated markets 52,936 59,719 47,995 99,409 44,046 Borsa Italiana cash regulated markets 38,974 N/A N/A N/A N/A Euronext derivatives regulated markets 185,677 505,522 458,626 1,195,733 427,535 3. Availability time of the system Optiq® Availability of Optiq® 2023 2022 2021 2020 2019 Cash regulated markets (%) 99.98 100 99.99 99.84 100 Derivatives regulated markets (%) 100 99.98 99.94 99.9 99.95 1 iBabs is part of Corporate Services, newly included in the scope for 2023. Its presented in a separate line to allow for consistent comparison year-on-year.
During the previous years, the survey consisted of short phone interviews with the following results:
2023 2022 Percentage of suppliers with SBTi set reduction targets on Scope 1 and Scope 2 (%) 32 20 7. Percentage of women in the Senior Leadership Team 2023 2022 2021 2020 2019 Number of women in the SLT (%) 34 34 34 36 33 8. Use of the Whistleblower mechanism 2023 2022 2021 2020 2019 Use of the Whistleblower mechanism 0 3 2 0 0 9. Data Protection training by new joiners to the company (new joiners still in Euronext as of 31.01.2024) 2023 2022 2021
comparable(a)
2021 2020 Staff assigned to the training (new joiners) 325 328 201 572 266 Staff completing the training (new joiners) 317 270 90 413 189 Percentage of total employees (%) 97.5 82 43 72 71 (a) These figures have not been assured. These figures are the adjusted numbers of 2021 to reflect the modifications of 2022 in the definition.
(b) Figures for 2022 have not been assured. These figures are the adjusted numbers of 2022 to reflect the more granular way to calculate the carbon footprint of data centers.
As a general rule, all the entities belonging to the Euronext group are in the scope for non-financial information as described in this ESG chapter except when it is specified otherwise.
1. Definition of “Serious Incident” has been agreed with the College of Regulators and is understood a “an event that has caused a market to stop or an event that although the market is still running a material number of members are prevented from trading for a technical reason. Such events could include, but not be limited to trading engine failures, market data dissemination issues, the calculation and/or publication of Official Index Values, issues with tools used to manage and operate the markets”. Severity 1 level corresponds to critical severity incidents and Severity 2 level corresponds to high severity incidents that may upgrade to a Serious Incident. The KPI concerns all clients and all equities, exchange traded funds (ETFs), warrants & certificates, bonds, derivatives, commodities and index markets. This KPI covers all the markets operated on the Optiq® trading technology. This KPI does cover Borsa Italiana from the date of the migration of the Italian markets on the Optiq® platform. This migration has taken place in different steps: Phase 1 migration of Equities and ETF in March 2023, so the scope of KPIs after March 2023 includes Borsa Italiana (BITA) in those two segments of Optiq - Phase 2 migration of Warrants and Fixed Income in September 2023, so the scope of KPIs after September includes BITA in 4 different segments of Optiq. 2. Euronext defines operational alerts as alerts that are automatically identified based on defined algorithms and followed-up by our Euronext Market Services (EMS) department. Examples of operational alerts are irregularities in price, volumes and/or market conditions. Alerts help the operational teams of EMS to secure the smooth running of the markets. The type or the scope of alerts may change over time. The KPI is to track the number of alerts being been raised and processed by EMS in order to secure a proper running of the markets and allowing a fair and orderly trading meaning the alerts which have been raised and processed by EMS. This KPI covers all the markets operated on the Optiq® trading technology. This KPI does cover Borsa Italiana from the date of the migration of the Italian markets on the Optiq® platform. 3. Optiq® is Euronext’s enhanced, multi-market trading platform, providing customers with maximum flexibility, simplified and harmonized messaging as well as high-performance and stability. Euronext aims to have the trading platform available to its members at least 99.99% of the time. The target is a platform availability between 99.9% and 100% overall on a yearly basis. Any Severity 1/Severity 2 Serious Incident impact Euronext regulated markets which are on the Optiq® trading platform, on trade reporting systems (TCS and Saturn) or impacting one of Euronext MTFs (platforms operated by Euronext but for which it is not license holder) focused on trading activity. This includes the activities linked with the CCPs but it excludes the CSD part. Also excluded are Euronext FX activities and Technology solutions. This KPI covers all the markets operated on the Optiq® trading technology. This KPI does cover Borsa Italiana from the date of the migration of the Italian markets on the Optiq® platform. 4. The KPI consists of calculating the percentage of net revenues related to ESG products and services offered by Euronext in all of its markets, including Borsa Italiana, compared to its overall revenues. Due to limitations of the systems, part of the ESG revenues have been calculated based on estimations. One estimated revenue is linked to premigration to Optiq for Borsa Italiana. This revenue is mostly trading fee for Bonds & ETFs which represent a very small part of the overall ESG revenue. This estimation due to pre-migration data will disappear going forward. An estimation that will remain in the future will be connectivity fee. It is expected that the overall connectivity trend on trading is the same for the ESG trading fee. It’s a conservative approach and a very small part of the overall ESG revenue. ESG trading revenue is calculated by applying an average fee by product to the total ESG trading volumes. The scope of the KPI has been slightly extended compared to 2022, to include the Sustainable Finance Partnership. The following are considered as ESG revenues: ■ ESG bonds: listing and the trading revenues linked to bonds admitted to listing/admitted to trading on all Euronext markets that are clearly labelled green, social, sustainability, sustainability-linked, etc... and are supported by a framework that is clearly aligned with recognizable industry standards such as the ICMA Principles, and by an independent external reviewer to verify. ■ ESG ETFs: listing and the trading revenues linked to ESG ETF for which the issuer has, in the admission form or post listing, confirmed the fund is ESG OR the index tracks an ESG index OR for which the Euronext ETF product team has - to the best of their knowledge and considering all publicly available information (such as issuer declaration, e.g. SFDR classifications) - determined the fund to be ESG. ■ ESG Funds: listing and the trading revenues linked to ESG Funds for which the issuer has, in the admission form or post listing, confirmed the fund either (i) promotes ESG characteristics or (ii) has a sustainable investment objective. ■ ESG indices: licencing on indices that are categorized as ESG in the benchmark statement issued according to the BMR. ■ ESG services: all the revenues generated by services delivered by Corporate services and Euronext Securities ■ Corporate Services: all the revenues generated by the fully-owned subsidiary of the Euronext Group called “Corporate Services” which help companies with innovative solutions and tailor-made advisory services in Governance (iBabs), Compliance (ComplyLog), Communication (Company Webcast) and Investor Relations (Advisory and IR Solutions). ■ Euronext Securities (CSDs): all the revenues generated by the various solutions provided by Euronext securities to companies to facilitate and improve the accessibility to their general meetings (AGMs & EGMs), to enable them to digitalize most of their governance processes, reduce the use of paper, reduce the travels, and therefore increase shareholder engagement. ■ The ESG revenues are also generated by the shareholders identification and shareholders register services. ■ The revenues generated by the initiative “Sustainable finance partnership” for which partners are provided with the «Borsa Italiana -Sustainable Finance Partner» Label. 5. The Net Promoter Score (NPS) indicates the difference between the so-called detractors and promoters on a scale from 1 to 10. Respondents are grouped as follows: “Detractors” (scores 0-6), “Neutral” (scores 7-8), and Promoters” (scores 9-10). By subtracting the percentage of detractors from the percentage of the promoters the NPS per brand is calculated. This figure can be somewhere between -100% and +100%. The survey has been conducted by an external provider IPSOS and concerns all kind of clients (issuers, trading members, market data providers, etc.) and all locations. The survey is performed once a year in Q3. The results enclosed in the URD are the results from the 2023 survey. As Euronext has done over the past few years, it is progressively expanding the scope of the survey in line with the expansion of the Group. Only FishPool, Commcise, Elite and Technology Solutions have been excluded. 6. Euronext aims to have 72% of purchased goods and services come from suppliers who have set targets on their scope 1 and 2 GHG emissions. This KPI is therefore calculated by first determining the top 72% of Euronext’s purchased goods and services, based on spend. This percentage this year is covered by Euronext’s top 160 suppliers ranked by spend. This is in line with SBTi guidance on calculating scope 3 emissions using the spend based approach. Subsequently, we determine how many, out of the top 160 suppliers, have set SBTi targets. This KPI represents that percentage. 7. The Senior Leadership Team (SLT) is an internal Executive group which is composed of senior managers from across the Group who are invited to help Euronext develop and achieve its strategic ambitions. The SLT is calculated annually based on the most recent SLT event. The composition is changing according to the strategy of the company. The SLT includes the Managing Board members. 8. The Company, via its Whistleblowing Policy, allows Employees and third parties to report in confidence alleged breaches of the laws or Company policies. The policy provides internal and external mechanisms. The internal mechanism allows employees to report alleged breaches either to the Compliance department or directly to the management or to the Chair of the Supervisory Board under specific circumstances, in which cases they must necessarily inform the Compliance department of the report received. The external mechanism is managed by the Compliance department per internet by a specialized provider and allows employees anonymous reporting. The KPI only concerns reported cases of whistleblowing. The KPI includes all the employees of the Group. 9. Data protection training by new joiners to the company is expressed in the total of new joiners assigned to this training and in the total of new joiners who completed the training. New joiners are defined as a new Euronext employee (as recorded in Euronext’s HR system: Workday) which are still in Euronext as of 31st of January 2024. The KPI includes only permanent and fixed-term contracts, and excludes new joiners who are experiencing long term absences. All new acquisitions (100%) made by Euronext are integrated in these processes as well after harmonisation where applicable. In 2023, the scope of this KPI has expanded to include all new joiners from Borsa Italiana and Nordpool. This training is carried out through Euronext Academy which keep track of the achievement of this by the employees. Other more specific awareness-raising / training campaigns are carried out in parallel either physically (with the signing of an attendance sheet), or through distribution by email or publication on the intranet on more specific or more in-depth subjects. 10. The KPI Personal data breaches concerns the total amount of reported data breaches in line with the GDPR Regulation (EU) 2016/679 of the European Parliament and of the Council of 27 April 2016 on the protection of natural persons with regard to the processing of Personal Data and on the free movement of such data (“GDPR”). Personal Data Breach’ is defined as “a breach of security leading to the accidental or unlawful destruction, loss, alteration, unauthorised disclosure of, or access to, personal data transmitted, stored or otherwise processed”. This KPI includes all Euronext employees. 11. Euronext’s carbon footprint is calculated based on the Bilan Carbone methodology. The chosen boundary of the footprint was Operational Control: emissions for the installations over which Euronext exercises control. All emissions sources relevant to Euronext’s activities have been included in the assessment. The emission factors used are the last version of the ones from ADEME (French Environment and Energy Management Agency) and other various official sources selected by Carbone 4, with sometimes reprocessing, except for business travels for which the factors are the ones defined by DEFRA (Department for Environment Food and Rural Affairs - UK). Those emissions factors are updated on a regular basis. The analysis covers the following scopes: ■ Scope 1: Direct GHG emissions occur from sources that are owned or controlled by the company, for example, emissions from combustion in owned or controlled boilers, furnaces, vehicles, etc.; emissions from chemical production in owned or controlled process equipment. ■ Scope 2: Indirect GHG emissions from consumption of purchased electricity, heat or steam ■ Scope 3: GHG emissions including other indirect emissions that occur in a company’s value chain i.e. employee travel and commuting, emissions associated with contracted solid waste disposal and wastewater treatment, transportation and distribution (T&D), etc. Euronext internalises the carbon footprint calculation with a dedicated software which automises the process. This implies a more accurate and complete coverage of the carbon footprint. Travel data are issued from the travel agency’s tool at the date of the booking.
In 2023, Euronext’s teams concentrated their efforts to improve the granularity of the Group’s data centres-related GHG emissions assessment and developed a new methodology with the help of Carbone 4. This more granular methodology, whereby the carbon footprint of cloud services is deduced from the details of the invoices for each service from each supplier, and emission from physical data centers are adapted to Euronext’s ownership (servers are currently owned by Euronext and installed in rented buildings), new acquisitions (purchases, rentals, etc) and the Power Usage Efficiency (PUE) at the various sites, was successfully implemented in the carbon footprint calculator tool used by Euronext and will enable a more accurate calculation of GHG emissions linked to the data centers.
-
Appendix – ESG section
Appendix 1) Taxonomy aligned-economic activities
Proportion of Turnover from products or services associated with Taxonomy-aligned economic activities - disclosure covering year 2023
Year Substantial Contribution Criteria DNSH criteria (‘Does Not Significantly Harm’) Economic Activities (1) Code (2) Turnover (3) Proportion of
Turnover,
2023 (4)Climate
Change
Mitigation (5)Climate
Change
Adaptation (6)Water (7) Pollution (8) Circular
Economy (9)Biodiversity (10) Climate
Change
Mitigation (11)Climate Change Adaptation (12) Water (13) Pollution (14) Circular
Economy (15)Biodiversity (16) Minimum
Safeguards (17)Proportion of
Taxonomy
aligned (A.1.)
or eligible (A.2.)
turnover,
2022 (18)Category
enabling
activity (19)Category
transitional
activity (20)k€ % Y ; N;
N/ELY ; N;
N/ELY ; N;
N/ELY ; N;
N/ELY ; N;
N/ELY ; N;
N/ELY ; N Y ; N Y ; N Y ; N Y ; N Y ; N Y ; N % E T A. Taxonomy-Eligible Activities A.1. Environmentally sustainable activities (Taxonomy-aligned) Turnover of environmentally sustainable activities (Taxonomy-aligned) (A.1) 0 0 Of which Enabling 0 0 E Of which Transitional 0 0 T A.2 Taxonomy-Eligible but not environmentally sustainable activities (not Taxonomy-aligned activities) Turnover of Taxonomy eligible but not environmentally sustainable activities (not Taxonomy-aligned activities) (A.2) 0 0 A. Turnover of Taxonomy eligible activities (A.1+A.2) 0 0 B. TAXONOMY-NON-ELIGIBLE ACTIVITIES Turnover of Taxonomy non-eligible activities 1,474,707 100 TOTAL 1,474,707 100 Proportion of CapEx from products or services associated with Taxonomy-aligned economic activities - disclosure covering year 2023
Year Substantial Contribution Criteria DNSH criteria (‘Does Not Significantly Harm’) Economic Activities (1) Code (2) CapEx (3) Proportion
of CapEx,
2023 (4)Climate
Change
Mitigation (5)Climate
Change
Adaptation (6)Water (7) Pollution (8) Circular
Economy (9)Biodiversity (10) Climate
Change
Mitigation (11)Climate Change Adaptation (12) Water (13) Pollution (14) Circular
Economy (15)Biodiversity (16) Minimum
Safeguards (17)Proportion of
Taxonomy
aligned (A.1.)
or eligible (A.2.)
CapEx,
2022 (18)Category
enabling
activity (19)Category
transitional
activity (20)k€ % Y ; N; Y ; N; Y ; N; Y ; N; Y ; N; Y ; N; Y ; N Y ; N Y ; N Y ; N Y ; N Y ; N Y ; N % E T N/EL N/EL N/EL N/EL N/EL N/EL A. Taxonomy-Eligible Activities A.1. Environmentally sustainable activities (Taxonomy- aligned) Installation, maintenance and repair of renewable energy technologies CCM-7.6 51 0.04 Y N/EL N/EL N/EL N/EL N/EL Y Y Y Y Y Y 0.22 E CapEx of environmentally sustainable activities (Taxonomy-aligned) (A.1) 51 0.04 0.04 0 0 0 0 0 Y Y Y Y Y Y 0.22 Of which Enabling 51 0.04 0.04 0 0 0 0 0 Y Y Y Y Y Y 0.22 E Of which Transitional 0 0 0 Y Y Y Y Y Y 0 T A.2 Taxonomy-Eligible but not environmentally sustainable activities (not Taxonomy-aligned activities) Renovation of existing buildings CCM-7.2 0 0 EL N/EL N/EL N/EL N/EL N/EL 7.65 Installation, maintenance and repair of energy efficiency equipment CCM-7.3 116 0.09 EL N/EL N/EL N/EL N/EL N/EL 0 Installation, maintenance and repair of renewable energy technologies CCM-7.6 0 0 EL N/EL N/EL N/EL N/EL N/EL 0 CapEx of Taxonomy eligible but not environmentally sustainable activities (not Taxonomy-aligned activities) (A.2) 116 0.09 0.09 0 0 0 0 0 7.65 A. CapEx of Taxonomy eligible activities (A.1+A.2) 166 0.13 0.13 0 0 0 0 0 7.87 B. TAXONOMY-NON-ELIGIBLE ACTIVITIES CapEx of Taxonomy non-eligible activities 130,187 99.87 TOTAL 130,353 100 Proportion of OpEx from products or services associated with Taxonomy-aligned economic activities - disclosure covering year 2023
Year Substantial Contribution Criteria DNSH criteria (‘Does Not Significantly Harm’) Economic Activities (1) Code (2) OpEx (3) Proportion
of OpEx,
2023 (4)Climate
Change
Mitigation (5)Climate
Change
Adaptation (6)Water (7) Pollution (8) Circular
Economy (9)Biodiversity (10) Climate
Change
Mitigation (11)Climate Change Adaptation (12) Water (13) Pollution (14) Circular
Economy (15)Biodiversity (16) Minimum
Safeguards (17)Proportion of
Taxonomy
aligned (A.1.)
or eligible (A.2.)
OpEx,
2022 (18)Category
enabling
activity (19)Category
transitional
activity (20)k€ % Y ; N; Y ; N; Y ; N; Y ; N; Y ; N; Y ; N; Y ; N Y ; N Y ; N Y ; N Y ; N Y ; N Y ; N % E T N/EL N/EL N/EL N/EL N/EL N/EL A. Taxonomy-Eligible Activities A.1. Environmentally sustainable activities (Taxonomy-aligned) OpEx of environmentally sustainable activities (Taxonomy-aligned) (A.1) 0 0 Of which Enabling 0 0 E Of which Transitional 0 0 T A.2 Taxonomy-Eligible but not environmentally sustainable activities (not Taxonomy-aligned activities) OpEx of Taxonomy eligible but not environmentally sustainable activities (not Taxonomy-aligned activities) (A.2) 0 0 A. OpEx of Taxonomy eligible activities (A.1+A.2) 0 0 B. TAXONOMY-NON-ELIGIBLE ACTIVITIES OpEx of Taxonomy non-eligible activities 858,470 100 TOTAL 858,470 100 -
4 CORPORATE GOVERNANCE
A description of the shareholding structure of the Company is provided in section 6 “General description of the Company and its share capital”.
4.1 Dutch Corporate Governance Code, “Comply or Explain” |DR|
In 2022, the 2016 Dutch Corporate Governance Code (“Code”) has been reviewed and updated in consultation with affected parties comprising labour unions and large and listed companies. On 20 December 2022, the Corporate Governance Code 2022 was published by the Monitoring Commission Corporate Governance Code. As of 1 January 2024, management reports for 2023 will need to account for compliance with the updated Code. The Code applies to Euronext as it has its registered office in the Netherlands and its shares are listed on the regulated markets of Euronext Amsterdam, Euronext Brussels, Euronext Lisbon and Euronext Paris. Dutch and English language versions of the Code are available at:
The Code is based on the notion that a company is a long-term alliance between the various stakeholders of the Company. Stakeholders are groups and individuals who, directly or indirectly, influence – or are influenced by – the attainment of the Company’s objectives: employees, shareholders and other lenders, suppliers, customers and other stakeholders. The Managing Board and the Supervisory Board are responsible for balancing these interests, generally with a view to ensuring the continuity of the Company and its subsidiaries, as the Company seeks to create sustainable long-term value. If stakeholders are to cooperate with the Company, they must be assured their interests are duly taken into consideration. Good entrepreneurship and effective supervision are essential conditions for stakeholder confidence in management and supervision. This includes integrity and transparency of the Managing Board’s actions and accountability for the supervision by the Supervisory Board.
The Code is based on a “comply or explain” principle. Accordingly, companies are required to state the extent to which they comply with the principles and best practice provisions of the Code in the director’s report and, where it does not comply with them, why and to what extent it deviates.
Euronext acknowledges the importance of good Corporate Governance and endeavors to comply with the provisions of the Code. However, there are a limited number of best practice provisions that it currently does not comply with, as further explained below. The fact that Euronext is not compliant with a number of best practice provisions is partly related to the fact that Euronext is an international company supervised since its creation in 2000 by a College of international Regulators, supervising Euronext on a joint basis, which has required some specific features which may interfere with the specific provisions of the Dutch Code. Euronext is active in a number of European jurisdictions, each with different laws, regulations, best practices, codes of conduct, regulatory guidelines and views.
■ Euronext did not apply best practice provision 2.1.7, item iii (“for each shareholder, or group of affiliated shareholders, who directly or indirectly hold more than ten percent of the shares in the Company, there is at most one Supervisory Board member who can be considered to be affiliated with or representing them”). Three members of the Supervisory Board namely Diana Chan, Alessandra Ferone and Olivier Sichel, have been proposed by Euronext’s Reference shareholders, who as a group acting via the Reference shareholders’ Agreement held 23.81% of Euronext’s shares on 31 December 2023. This group of shareholders has committed to a lock-up of their shares in Euronext for a certain period, and acts jointly in relation to certain voting matters and has been granted a declaration of non-objection by the Dutch Ministry of Finance. The background of the presence of three members in Euronext’s Supervisory Board who can be considered to be affiliated with or representing the Reference shareholders is related to the request of the Euronext College of Regulators at the moment of its IPO in 2014 for it to have a number of stable, long-term shareholders who could propose one third of the members of the Supervisory Board. Provisions of the Dutch Code regarding the remuneration policy of the Managing Board that Euronext did not apply in 2023:
■ Euronext did not apply best practice provision 3.1.2 vi (“...Shares should be held for at least five years after they are awarded”). However, starting 2021 and in order to be aligned with Dutch Corporate Governance Code recommendation and to strengthen the alignment of the Chief Executive Officer exposure to the Euronext development with the shareholders’ exposure, the Supervisory Board introduced to the Managing Board Remuneration Policy an additional 2 years lock-up for the Chief Executive Officer resulting in a total five-year period from the date of grant and increased motivation for sustainable performance. ■ Euronext did not apply best practice provision 3.2.3 (“the remuneration in the event of dismissal should not exceed one year’s salary (the “fixed” remuneration component”). In the event of dismissal by the Company of a member of the Managing Board the Company has decided to align progressively all new Managing Board members’ contracts on the same basis as was decided at the time of recruitment of the Chair of the Managing Board in September 2015, and disclosed at the Shareholders’ Meeting of 27 October 2015: the limitation to twelve months of fixed salary as provided in the Dutch Corporate Governance Code has been balanced against governance codes and relevant best practices in the various other jurisdictions in which it is active. E.g. the French AFEP-MEDEF Corporate Governance Code recommendations provide for a maximum termination indemnity of twenty-four months compensation, fixed and variable remuneration. The termination indemnity has been limited to twice the annual fixed salary. Managing Board members’ contracts have been amended to that effect. ■ Euronext did not apply best practice provision 4.2.3 (“meetings with analysts, presentations to analysts, presentations to investors and institutional investors and press conferences shall be announced in advance on the Company’s website and by means of press releases, enabling all shareholders to follow these meetings and presentations in real time, for example by means of webcasting or telephone”): Euronext does not always allow shareholders to follow meetings with analysts and institutional investors in real time. Euronext ensures that all shareholders and other parties in the financial markets are provided with equal and simultaneous information about matters that may influence the share price. -
4.2 MANAGEMENT STRUCTURE |DR|
4.2.1 General Information
No information on family relationships between members of the Supervisory Board, members of the Managing Board and senior staff, as well as on convictions in relation to fraudulent offences, bankruptcies, receiverships, liquidations, companies put into administration, official public sanctions or official public incriminations with regard to these persons has been included in this Universal Registration Document, as these matters are not applicable to these persons.
Further, up to the date of the publication of this Universal Registration Document, the members of the Supervisory Board, of the Managing Board and senior staff do not have potential conflicts of interest between any duties to the Company and private interests. In addition, there are no potential conflicts of interest between the duties carried out on behalf of the Company by members of the administrative, management or supervisory bodies or any senior manager of the Company who is relevant to establishing that the Company has the appropriate expertise and experience for the management of the Company’s business, and their private interest or other duties.
When new cases are discussed at Supervisory Board and Managing Board meetings, a regular conflict check is performed in accordance with the Conflict of Interest policy. Conflicted board directors, if any, will neither be allowed to attend nor to participate in such discussion.
The professional address of all members of the Supervisory Board, Managing Board and senior staff of Euronext is Beursplein 5,1012 JW, Amsterdam, the Netherlands.
In accordance with Article 5:25c(2)(c) of the Dutch Financial Supervision Act (Wet op het financieel toezicht), the Managing Board of Euronext hereby declares that, to the best of its knowledge, (i) the Financial Statements prepared in accordance with IFRS as adopted by the European Union and with Part 9, Book 2 of the Dutch Civil Code give a true and fair view of the assets, liabilities, financial position and profit or loss of Euronext and the enterprises included in the consolidation as a whole, and (ii) the directors’ report gives a true and fair view of the position on the balance sheet date, the course of events during the financial year of Euronext and the enterprises included in the consolidation as a whole, together with a description of the principal risks that Euronext faces.
The Managing Board declares that the information contained in the Universal Registration Document, including the Financial Statements and the directors’ report, is, to the best of its knowledge, in accordance with the facts and contains no omission likely to affect its import. The Managing Board is responsible for this Universal Registration Document.
Euronext’s first and second lines of defence perform their roles in risk assessments, evaluations of the operating effectiveness of controls, and reporting on risk management and control. The concluding results are regularly discussed at senior and executive management level and in the Risk Committee. Internal Audit, as the third line of defence, evaluates both the design and effectiveness of Euronext’s governance, risk management and control processes. Audit reports are discussed with risk and process owners and the Audit Committee.
Based on the risk management processes, the Managing Board makes the following statements regarding internal risk management and control, taking into account Euronext’s strategy and risk profile.
In accordance with best practice provisions 1.4.2. and 1.4.3 of the Dutch Corporate Governance Code, Euronext’s Managing Board is of the opinion that, in respect of financial reporting risks, the design and operation of the internal risk management and control system, as described in 2.3.2.2 “Risk management” and 2.3.2.5 “Internal control” (i) provides a reasonable level of assurance that the financial reporting in this Universal Registration Document does not contain any errors of material importance, and (ii) has worked properly during the financial year 2023.
As set out in section 2.2 - Mitigation Measures, Euronext has a robust Enterprise Risk Management Framework and Governance, which allow the Managing Board to identify and assess the Company’s principal risks to enable strong decision making with regards to the execution of the stated strategy. On the basis hereof the Managing Board has assessed the risk profile and the design and operating effectiveness of the risk management and control systems; this was discussed with the Audit Committee of the Supervisory Board.
The Managing Board declares that, based on the current state of affairs including financial position and strategic prospects, the implementation of the Business Continuity Framework and the reporting process on existing or potential material risks, as set out under 2.2.1, this Universal Registration Document provides sufficient insights into any failings in the effectiveness of the internal risk management and control systems with regard to the risks as referred to in best practice provision 1.2.1, the aforementioned systems provide reasonable assurance that the financial reporting does not contain any material inaccuracies, based on the current state of affairs, it is justified that the financial reporting is prepared on a going concern basis, and this Universal Registration Document states the material risks, as referred to in best practice provision 1.2.1, and the uncertainties, to the extent that they are relevant to the expectation of the company’s continuity for the period of twelve months after the preparation of this Universal Registration Document.
-
4.3 REPORT OF THE SUPERVISORY BOARD
4.3.1 Meetings
The Supervisory Board met nine times in 2023: there were four in-person meetings, and five meetings by videoconferencing.
The Supervisory Board discussed amongst others the following topics: the quarterly, half year and full year results, the dividend proposal, the 2024 budget and forecast, the agendas of the General Meetings, including the nomination for appointments and re-appointments to the Supervisory Board and the Managing Board, the nomination of the external auditor, the strategy, the implementation of the strategy and the principal risks associated with it, the risk profile, cyber security, ESG risks and opportunities, M&A opportunities, the integration of the Borsa Italiana Group and the migration of clients to the Core Data Centre, to Euronext Clearing and to Optiq. It monitored the activities of the Managing Board with regard to creating a culture aimed at long-term value creation for the company and its affiliated enterprise, and with regard to procedures for reporting actual or suspected irregularities.
It also discussed the items that its committees reported on, and their deliberations and findings. Among those items were, in addition to the items mentioned above, the investor base, the share price development, the internal and external audit planning and reports, litigations, annual performance criteria, compensation programs, the evaluation and assessment of the Managing Board and the Supervisory Board, the composition of the Managing Board, the composition and rotation schedule of the Supervisory Board and succession planning.
-
4.4 REMUNERATION REPORT OF THE REMUNERATION COMMITTEE
4.4.1 2023 Report
On behalf of the Board, I am pleased to present the Remuneration Report for the financial year ending 31 December 2023.
The Remuneration Committee and the Supervisory Board are committed to reinforcing our reporting year by year, complying with the latest rules, regulations and say-on-pay guidance, including the Shareholder Rights Directive and related Dutch implementation Act, the Dutch Corporate Governance Code and the 2021 Remuneration Policy. The Group engaged actively with shareholders, continuing our constructive dialogue during several roadshow meetings where we presented the implementation of the 2021 Remuneration Policy and the evolution of the Remuneration Report.
This report has been prepared by the Remuneration Committee and was approved by the Supervisory Board.
The Remuneration Committee held five meetings during 2023, where the members monitored the implementation of the 2021 Remuneration Policy.
The Remuneration Committee discussed specific contributions to the delivery of the integration plan of Borsa Italiana and some senior management retention risks during the course of the year. The Remuneration Committee addressed these specific challenges through a special one-off Integration LTI grant for the Group Chief Executive Officer and for the Chief Operating Officer, granted in February 2024. This grant will be subject to the performance conditions of the plan and to the three-year vesting period. The Supervisory Board decided to approve this exceptional remuneration within the Remuneration Policy, in the best interest of the company, to recognise specific contributions, reinforce retention, and support the next phase of growth of Euronext.
The Committee analysed, as it does every year, the outcome of the annual performance criteria, their impact on Short Term Incentives, Long Term Incentives and total compensation of the members of the Managing Board, and proposed subsequent decisions to the Supervisory Board. The key 2023 performance indicators and strategic achievements are summarised in this report and form the basis of the 2023 remuneration decisions.
The 2021 Remuneration Policy approved by shareholders at the AGM with 97.55% favourable votes on 11 May 2021 was still applicable in 2023.
Following positive feedback received from shareholders and stakeholders, the Remuneration Committee has decided to keep this policy unchanged for 2024. The Remuneration Committee will consult shareholders and stakeholders in 2024 to prepare an updated Remuneration Policy to be approved during the AGM in 2025.
The Remuneration Committee of Euronext assists the Supervisory Board with respect to the Company’s remuneration strategy and principles for members of the Managing Board of the Company (the “Managing Board”), the administration of its cash and equity based compensation plans and draft proposals to the Supervisory Board and oversees the remuneration programmes and remuneration of the Company’s senior managers and other personnel. The Remuneration Committee meets as often as necessary and whenever any of its members requests a meeting.
The Remuneration Committee as at 31 December 2023 consisted of the following members: Nathalie Rachou (chair), Diana Chan, Rika Coppens, Padraic O’Connor and Piero Novelli.
In 2023, Euronext has delivered very strong performance, thanks to the ongoing delivery of the committed €115 million synergies related to the integration of Borsa Italiana17, tight cost control in an environment of persistent labour inflation and successful diversification of the top line of the group. Euronext’s focus on performance and cost discipline allowed the Company to beat the 2023 budget on both underlying revenues and underlying costs.
17 In February 2023, Euronext announced upgrading its targeted synergies to €115 million pre-tax run-rate
i. Underlying Revenue increased +0.5% to €1,474.7 million for 2023, versus €1,467.8 million for 2022. ii. Underlying EBITDA18 increased +0.4% to €864.7 million, versus €861.6 million for 2022. iii. Underlying EBITDA margin19 was maintained at 58.6% versus 58.7% in 2022. iv. Underlying net income increased +5.3% to €584.7 million versus €555.3 million for 2022. v. Adjusted EPS20 was at €5.51, versus €5.21 for 2022. The Euronext team delivered major operational, financial and strategic milestones in 2023, in line with the “Growth for Impact 2024” strategic plan, which have clearly transformed Euronext:
a. Euronext mitigated the negative consequences of the challenging environment in 2023, with the wars in Ukraine and the Middle-East, the persistently high labour cost inflation and interest rates and lowest equity volumes since 2017, keeping its European leadership in equity trading and listing. b. Euronext made decisive progress towards achieving its commitment on the 2024 synergies, delivering €74 million by the end of 2023, more than the €60 million initially targeted for the end of 2024; and is in a very strong position to deliver by the end of 2024 the €115 million synergies as revised in February 2023, and at a lower cost than initially anticipated. c. Euronext completed the most decisive steps in the integration of Borsa Italiana, whose organisation, governance, operations and technology are now almost fully integrated in the group. d. Euronext successfully completed on time the two most critical phases of the migration of Borsa Italiana markets onto the Euronext trading platform Optiq®; and is on track to deliver the last phase of the migration on 25 March 2024. This last migration will allow Euronext to fully terminate any dependency of Euronext on LSEG services provided to Borsa Italiana. e. Euronext successfully delivered in November 2023 the first phase of the European expansion of Euronext Clearing, through the migration to the value-at-risk risk framework and the critical migration of cash clearing, thereby positioning Euronext Clearing as the CCP of choice for all its cash equity markets, paving the way for an expansion of Euronext Clearing to financial and commodities derivatives markets in June 2024. f. Euronext rolled-out a new business organisation that empowers business line leaders to strengthen its ability to deliver more organic growth, to inject more energy and agility, to reinforce the coordination between business lines and IT, Operations and support functions and to accelerate time to market of growth initiatives. g. Euronext took decisive steps to harmonise CSD products, technology, operations and governance to increase operational efficiencies, reinforce coordination with the rest of the group and to seize future growth opportunities. This effort complements the continuous convergence of the sales and client approach. h. Euronext maintained its capital allocation discipline, executing a €200 million share repurchase programme without impacting the planned deleveraging process nor Euronext’s M&A capabilities. Euronext was upgraded to a BBB+ rating by S&P, returning to the rating it used to have before the acquisition of Borsa Italiana, an illustration of the strong deleveraging pattern of the company. i. Euronext expanded on its leadership on ESG. Euronext became the world leader for ESG bond listing, with a 31% global market share, and is the first exchange to make available to investors the ESG data of their issuers, through its My ESG Profile tool. Euronext is also on track to deliver its SBTI-approved carbon reduction targets. -
5 SELECTED HISTORICAL CONSOLIDATED FINANCIAL INFORMATION AND OTHER FINANCIAL INFORMATION |DR|
In accordance with Article 19 of Regulation (EU) 2017/1129, the following information is incorporated by reference in the Universal Registration Document:
Required disclosures in the report of the Managing Board appearing in the Statement of the Managing Board, the Consolidated Financial Statements are presented on pages 221-312 and the corresponding auditor’s report is presented on page 316 of the 2022 Universal Registration Document filed with the Autoriteit Financiële Markten on 30 March 2023 and available at:
https://www.euronext.com/sites/default/files/financial-event-doc/2023-08/EUR_2022_URD_MEL%20FINALE_AUG.pdf
Required disclosures in the report of the Managing Board appearing in the Statement of the Managing Board, the Consolidated Financial Statements are presented on pages 213-298 and the corresponding auditor’s report is presented on page 299 of the 2021 Universal Registration Document filed with the Autoriteit Financiële Markten on 31 March 2021 and available at:
https://www.euronext.com/sites/default/files/financial-event-doc/2022-04/2021%20URD%20-%20ENX%20-%20PDF_1.pdf
5.1 Selected Historical Consolidated Financial Information
The selected consolidated financial information set out below is derived from the audited Consolidated Financial Statements for the financial years ended 31 December 2023, 2022 and 2021 and should be read in conjunction with, and is qualified by reference to, those Consolidated Financial Statements.
Year ended In thousands of euros 31 December 2023 31 December 2022 31 December 2021 Revenue Listing 220,642 218,380 189,689 Trading revenue 490,008 514,125 465,265 of which ■ Cash trading 265,439 301,714 293,684 ■ Derivatives trading 54,168 58,380 52,458 ■ Fixed income trading 107,425 92,951 65,783 ■ FX trading 25,556 28,406 23,479 ■ Power trading 37,420 32,674 29,861 Investor Services 11,375 9,596 8,894 Advanced data services 224,774 212,053 183,607 Post-trade 370,183 364,519 320,570 of which ■ Clearing 121,283 121,393 101,376 ■ Custody & Settlement and other 248,900 243,126 219,194 Euronext Technology Solutions & Other revenue 109,894 100,101 85,498 Net treasury income/(loss) through CCP business 46,660 (4,913) 35,432 Other income 1,393 1,530 3,455 Transitional income / (loss) (222) 3,419 6,245 TOTAL REVENUE AND INCOME 1,474,707 1,418,810 1,298,655 Salaries and employee benefits (332,416) (307,017) (287,073) Depreciation and amortisation (170,131) (160,191) (134,572) Other operational expenses (355,923) (326,344) (297,719) OPERATING PROFIT 616,237 625,258 579,291 Finance costs (35,714) (37,078) (40,704) Finance income (a) 30,526 5,806 1,479 Other net financing result (a) 5,208 (691) 4,833 Results from equity investments 23,500 9,842 25,712 Gain on sale of subsidiaries (206) 2,274 2,681 Gain on sale of associates 53,028 – – Share of net profit from associates and joint ventures accounted for using the equity method, and impairments thereof 6,533 8,834 7,441 PROFIT BEFORE INCOME TAX 699,112 614,245 580,733 Income tax expense (162,697) (163,605) (158,644) PROFIT FOR THE YEAR 536,415 450,640 422,089 PROFIT ATTRIBUTABLE TO: ■ Owners of the parent 513,567 437,827 413,344 ■ Non-controlling interest 22,848 12,813 8,745 (a) As from 2023, the Group presents finance income separately on the face of the income statement, following increased income from interest calculated using the effective interest method. The Group re-presented the comparative periods accordingly by reclassifying €5.8 million in 2022 and €1.5 million in 2021 from ‘Other net financing results’ that was originally reported at €5.1 million in 2022 and at €6.3 million in 2021. In thousands of euros As at 31
December 2023As at 31
December 2022As at 31
December 2021ASSETS Non-current assets Property, plant and equipment 114,373 109,389 97,580 Right-of-use assets 55,739 42,290 66,168 Goodwill and other intangible assets 6,108,152 6,205,826 6,215,844 Deferred tax assets 31,258 18,917 37,489 Investments in associates and joint ventures 1,329 72,009 69,237 Financial assets at fair value through other comprehensive income 262,655 278,219 258,068 Financial assets at amortised cost 3,452 2,312 2,902 Other non-current assets 1,088 1,374 1,317 Total non-current assets 6,578,046 6,730,336 6,748,605 Current assets Trade and other receivables 303,515 318,087 394,986 Other current assets 30,128 27,585 21,573 Income tax receivables 58,563 54,931 9,965 Derivative financial instruments – – 11,913 CCP clearing business assets 183,715,218 166,842,539 137,750,884 Other current financial assets 103,053 162,740 157,590 Cash and cash equivalents 1,448,788 1,001,082 804,361 Total current assets 185,659,265 168,406,964 139,151,272 Assets from disposal groups held for sale – – 6,436 Total assets 192,237,311 175,137,300 145,906,313 EQUITY AND LIABILITIES Equity Issued capital 171,370 171,370 171,370 Share premium 2,432,426 2,432,426 2,432,426 Reserve own shares (242,117) (32,836) (42,778) Retained earnings 1,543,458 1,265,765 1,022,921 Other reserves 40,554 77,242 63,647 Shareholders’ equity 3,945,691 3,913,967 3,647,586 Non-controlling interests 139,655 126,339 123,114 Total equity 4,085,346 4,040,306 3,770,700 Non-current liabilities Borrowings 3,031,629 3,027,161 3,044,391 Lease liabilities 37,314 21,648 50,691 Deferred tax liabilities 531,895 552,574 592,431 Post-employment benefits 22,677 19,631 32,123 Contract liabilities 60,029 63,785 70,276 Provisions 7,295 7,049 8,847 Total non-current liabilities 3,690,839 3,691,848 3,798,759 Current liabilities Borrowings 17,286 17,370 17,359 Lease liabilities 22,159 28,466 20,993 Derivative financial instruments 34 19 – CCP clearing business liabilities 183,832,245 166,858,684 137,732,403 Current income tax liabilities 89,120 28,463 42,068 Trade and other payables 415,843 396,287 439,856 Contract liabilities 79,270 75,198 80,546 Provisions 5,169 659 2,308 Total current liabilities 184,461,126 167,405,146 138,335,533 Liabilities from disposal groups held for sale – – 1,321 Total equity and liabilities 192,237,311 175,137,300 145,906,313 Year ended In thousands of euros 31 December 2023 31 December 2022 31 December 2021 Net cash generated by operating activities 826,073 616,486 543,706 Net cash provided by/(used in) investing activities (b) 155,392 (122,585) (4,210,509) Net cash (used in)/ provided by financing activities (b) (519,700) (282,368) 3,834,087 NET INCREASE/(DECREASE) IN CASH AND CASH EQUIVALENTS 461,765 211,533 167,284 Cash and cash equivalents - Beginning of period 1,001,082 809,409 629,469 Non-cash exchange (losses)/ gains on cash and cash equivalents (14,059) (19,860) 12,656 CASH AND CASH EQUIVALENTS - END OF PERIOD (a) 1,448,788 1,001,082 809,409 (a) Includes €5.0 million of cash and cash equivalents classified as held for sale for the year ended 31 December 2021.
(b) As from 2023, the Group presents ‘interest received’ as part of cash flows from investing activities, whereas in previous periods this item was presented as part of cash flows from financing activities. The Group re-presented the comparative periods accordingly by reclassifying €5.9 million in 2022 and €5.0 million in 2021 from ‘Net cash (used in)/ provided by financing activities’ to ‘Net cash provided by/(used in) investing activities’.
-
5.2 Other Financial Information
In presenting and discussing the Group’s financial position, (‘underlying’) operating results and (‘underlying’) net results throughout this Universal Registration Document, management uses certain Alternative performance measures not defined by IFRS and that have not been audited or reviewed. These Alternative performance measures (APMs) should not be viewed in isolation as alternatives to the equivalent IFRS measures and should be used as supplementary information in conjunction with the most directly comparable IFRS measures. Alternative performance measures do not have standardised meaning under IFRS and therefore may not be comparable to similar measures presented by other companies. Euronext believes that these measures provide valuable supplemental information to the company’s management, investors and other stakeholders to evaluate the company’s performance.
The Group presents the line items of its consolidated income statement before any ‘non-underlying’ items, as this highlights more clearly trends in the Group’s business and results in more reliable and relevant information of the Group’s ongoing sustainable financial performance.
The table below summarises the various APMs used throughout this Universal Registration Document, as well as the Group’s rationale and purpose to use a specific APM.
Alternative Performance Measure Definition Rationale / purpose of use Adjusted net income Profit attributable to the owners of the Parent adjusted for any non-underlying items and tax related to those items. Adjusted net income is used by the Group to provide to investors a better understanding of the true profitability of the Group for the applicable period. Adjusted EPS The adjusted net income of the Group divided by the total weighted average number of shares outstanding for the period Adjusted EPS is used by the Group to provide to investors a better understanding of the true profitability per share of the Group for the applicable period. Free cash flow Net cash generated by operating activities minus capital expenditures Free cash flow represents the cash generating capability of the Group to pay dividends, repay providers of capital, or carry out acquisitions. Capital expenditures Purchase of property, plant and equipment plus purchase of intangible assets, including investments in software developed in-house Capital expenditures indicate the Group’s appetite to invest in existing and new fixed assets to maintain or grow the business. Non-underlying items Items of income and expense that are material by their size and/or that are infrequent and unusual by their nature or incidence are not considered to be incurred in the normal course of business. These items are disclosed in Chapter 8, Note 3, section U of the URD. Non-underlying items are presented separately in the Consolidated Statement of Profit or Loss, as defined in section 8.1 of the URD in order to improve the understanding of the operating performance of the Group. Adjusted operating profit Total revenues and income minus salaries and employee benefits, minus depreciation and amortisation minus other operating expenses, adjusted for any non-underlying items. Adjusted operating profit is used by the Group to measure its profit generated from its core business functions. Adjusted depreciation and amortisation Depreciation and amortisation, adjusted for any non-underlying items. Adjusted depreciation and amortisation is used by the Group to measure its depreciation and amortisation generated from its core business functions. Adjusted total revenue and income Total revenue and income, adjusted for any non-underlying items. Adjusted total revenue and income is used by the Group to measure its total revenue and income generated from its core business functions. EBITDA Operating profit before depreciation and amortisation. EBITDA is used by the Group to measure its operating performance. Adjusted EBITDA Adjusted operating profit before adjusted depreciation and amortisation. Adjusted EBITDA is used by the Group to measure its operating performance, as management believes that this measurement is most relevant in evaluating the operating results of the Group. This measure is included in the internal management reports that are reviewed by the CODM. EBITDA margin EBITDA (as defined above), divided by total revenue and income. EBITDA margin is used to show the ratio between the EBITDA and the revenue and income. Adjusted EBITDA margin Adjusted EBITDA (as defined above), divided by adjusted total revenue and income. Adjusted EBITDA margin is used to show the ratio between the Adjusted EBITDA and the revenue and income. EBITDA to Net operating cash flow Net cash generated by operating activities, divided by EBITDA (as defined above). This ratio, also called cash conversion ratio, is used to assess the efficiency of the Group to turn the EBITDA into cash. Net debt to EBITDA ratio The aggregated non-current and current borrowings of the Group less cash and cash equivalents of the Group, divided by EBITDA (as defined above) This ratio is used as a proxy to assess the Group’s solvency (i.e. its ability to face its financial commitments in the long run). The figures used in the reconciliation tables below have been derived from the Consolidated Financial Statements as provided in section 8 of this Universal Registration Document.
Reconciliation of Adjusted Total revenue and income, Adjusted Depreciation and amortisation and Adjusted Operating Profit
Year ended In thousands of euros 31 December 2023 31 December 2022 31 December 2021 Total revenue and income 1,474,707 1,418,810 1,298,655 Non-underlying items included in total revenue and income – (48,951) – Adjusted Total revenue and income (a) 1,474,707 1,467,761 1,298,655 Depreciation and amortisation (170,131) (160,191) (134,572) Non-underlying items included in depreciation and amortisation (95,916) (91,362) (73,180) Adjusted Depreciation and amortisation (a) (74,215) (68,829) (61,392) Operating profit 616,237 625,258 579,291 Non-underlying items included in total revenues and income – (48,951) – Non-underlying items included in salaries and employee benefits (12,931) (5,958) (11,273) Non-underlying items included in depreciation and amortisation (95,916) (91,362) (73,180) Non-underlying items included in other operational expenses (65,367) (21,259) (45,891) Non-underlying items included in operating profit (174,214) (167,530) (130,344) Adjusted Operating profit (a) 790,451 792,788 709,635 (a) Adjusted Operating profit, Adjusted Depreciation and amortisation and Adjusted Total revenue and income are non-IFRS measures and should not be considered as an alternative to, or more meaningful than, and should be read in conjunction with Operating profit, Total revenue and income, Salaries and employee benefits, Depreciation and amortisation and Other operational expenses. Reconciliation of EBITDA, Adjusted EBITDA, EBITDA margin, Adjusted EBITDA margin, EBITDA to Net operating cash flow and Net debt to EBITDA ratio
Year ended In thousands of euros (except for percentages and ratios) 31 December 2023 31 December 2022 31 December 2021 Operating profit 616,237 625,258 579,291 Depreciation and amortisation (170,131) (160,191) (134,572) EBITDA(a) 786,368 785,449 713,863 Total revenue and income 1,474,707 1,418,810 1,298,655 EBITDA margin(a) 53.3 % 55.4 % 55.0 % Adjusted Operating profit 790,451 792,788 709,635 Adjusted Depreciation and amortisation (74,215) (68,829) (61,392) Adjusted EBITDA(a) 864,666 861,617 771,027 Adjusted Total revenue and income 1,474,707 1,467,761 1,298,655 Adjusted EBITDA margin(a) 58.6 % 58.7 % 59.4 % Net cash generated by operating activities 826,073 616,486 543,706 EBITDA to Net operating cash flow(a) 105.0 % 78.5 % 76.2 % Non-current Borrowings 3,031,629 3,027,161 3,044,391 Current Borrowings 17,286 17,370 17,359 Less: Cash and cash equivalents (1,448,788) (1,001,082) (804,361) Net debt 1,600,127 2,043,449 2,257,389 Net debt to EBITDA ratio(a) 2.03 2.60 3.16 (a) EBITDA, Adjusted EBITDA, EBITDA margin, Adjusted EBITDA margin, EBITDA to Net operating cash flow and Net debt to EBITDA ratio are non-IFRS measures and should not be considered as an alternative to, or more meaningful than, and should be read in conjunction with Operating profit, Depreciation and amortisation, Total revenue and income, Net cash generated by operating activities, Non-current Borrowings, Current Borrowings and Cash and cash equivalents. Year ended In thousands of euros 31 December 2023 31 December 2022 31 December 2021 Net cash generated by operating activities 826,073 616,486 543,706 Purchase of property, plant and equipment (27,703) (31,867) (33,367) Purchase of intangible assets (excluding intangible assets recognised on acquisition of subsidiaries) (75,333) (67,650) (34,223) Capital Expenditures(a) (103,036) (99,517) (67,590) Free Cash Flow(a) 723,037 516,969 476,116 (a) Free Cash Flow and Capital Expenditures are non-IFRS measures and should not be considered as an alternative to, or more meaningful than, and should be read in conjunction with, Net cash generated by operating activities. Year Ended In millions of euros, unless stated otherwise 31 December 2023 31 December 2022 31 December 2021 Profit attributable to the owners of the Parent 513.6 437.8 413.3 EPS (Basic Earnings per Share) (€ per share) 4.84 4.10 4.30 Adjustments for non-underlying items included in: Total revenue and income – (49.0) – Depreciation and amortisation (D&A) (95.9) (91.4) (73.2) Operating expenses excluding D&A (78.3) (27.2) (57.2) Finance cost – – (9.9) (Loss)/ gain on disposal of subsidiaries (0.2) 2.3 2.7 Gain on sale of associates 53.0 – – Impairment of investments in associates and joint ventures – (1.5) (4.3) Non-controlling interests 4.1 4.6 0.9 Tax related to non-underlying items 46.2 44.7 28.8 Adjusted Net Income(a) 584.7 555.3 525.5 Adjusted EPS (€ per share)(a) 5.51 5.21 5.47 -
6 GENERAL DESCRIPTION OF THE COMPANY AND ITS SHARE CAPITAL |DR|
6.1 Legal information on the company
6.1.1 General
Euronext is a public company with limited liability (naamloze vennootschap) incorporated under the laws of the Netherlands and is domiciled in the Netherlands. The Company was incorporated in the Netherlands on 15 March 2014.
Euronext’s statutory seat (statutaire zetel) is in Amsterdam, the Netherlands, and its registered office and principal place of business is at Beursplein 5, 1012 JW Amsterdam, the Netherlands.
The Company is registered with the trade register of the Chamber of Commerce for Amsterdam, the Netherlands, under number 60234520, and the telephone number is +31 (0)20-7214444. Euronext’s LEI is 724500QJ4QSZ3H9QU415 and its corporate website is https://www.euronext.com/en.
Other than the sections of the 2021 and 2022 Universal Registration Document that are explicitly incorporated by reference in this Universal Registration Document, the contents of Euronext’s website, or of websites accessible from hyperlinks on that website, do not form part of, and are not incorporated by reference into, this Universal Registration Document.
-
6.2 Share capital
6.2.1 Authorised and Issued Share Capital
Under the Articles of Association, Euronext’s authorised share capital amounts to €200,000,001.60 and is divided into 125,000,000 Ordinary Shares, each with a nominal value of €1.60 and one priority share with a nominal value of €1.60. All of Euronext’s shares have been or will be created under Dutch law.
Throughout 2023, Euronext’s issued share capital amounted to €171,370,070.40 and was divided into 107,106,294 Ordinary Shares. As of 31 December 2023, Euronext held 3,440,126 shares in its own shares. The Priority Share is currently not outstanding. All shares that are issued at the date of this Universal Registration Document are fully paid up.
As of 31 December 2022, Euronext’s issued share capital amounted to €171,370,070.40 and was divided into 107,106,294 Ordinary Shares.
All shares carry the same voting rights, with the exception of shares that are held by the Company or its subsidiaries, which are not entitled to be voted upon. There are no convertible securities, exchangeable securities or securities with warrants in Euronext. All of the Ordinary Shares represent capital in Euronext. No share or loan capital of any member of the Euronext group is under option or agreed, conditionally or unconditionally, to be put under option.
Between 31 July 2023 and 4 January 2024, a €200 million share repurchase programme (“the Programme”) was completed. The Programme was implemented in accordance with the authorisation given to the Managing Board of the Company at the 2023 Annual General Meeting on 17 May 2023 to acquire ordinary shares in the share capital of the Company on behalf of the Company to a limit of 10.0% of the share capital of the Company. Over the duration of the programme, 2,870,787 shares, or approximately 2.7% of Euronext’s share capital as of 31 December 2023, were repurchased at an average price of €69.67 per share.
The purpose of the Programme was to reduce the share capital of Euronext and the Programme was executed by a financial intermediary in compliance with applicable rules and regulations, including the Market Abuse Regulation (EU) No 596/2014 and the Commission Delegated Regulation (EU) 2016/1052.
Euronext is subject to the provisions of the Dutch Financial Supervision Act and the Articles of Association with regard to the issue of shares following admission. The shares are in registered form and are only available in the form of an entry in Euronext’s shareholders’ register and not in certificated form.
-
6.4 Share classes and Major Shareholders
6.4.1 Reference Shareholders
Prior to the IPO, on 27 May 2014, a group of institutional investors (collectively, the “Reference Shareholders”, and each a “Reference Shareholder”) purchased an aggregate of 33.36% of the issued and outstanding Ordinary Shares from ICE, the selling shareholder at the IPO, at €19.20 or a 4% discount to the offer price (€20.00).
The initial group of Reference shareholders was comprised of Novo Banco, BNP Paribas S.A., BNP Paribas Fortis S.A./N.V., ABN AMRO Bank N.V. through its subsidiary ABN AMRO Participaties Fund I B.V., ASR Levensverzekering N.V. (a company of the ASR Nederland group), Caisse des Dépôts et Consignations, Bpifrance Participations, Euroclear S.A./N.V., Société Fédérale de Participations et d’Investissement/Federale Participatie- en Investeringsmaatschappij, Société Générale and Banco BPI Pension Fund represented by BPI Vida e Pensões - Companhia de Seguros, S.A.
On 3 June 2014, the initial Reference Shareholders entered into an agreement (the “Reference Shareholders Agreement”) in relation to their shareholdings in Euronext N.V.. Subsequently, a first Reference Shareholders extension agreement was executed on 17 June 2017 and a second Reference Shareholders Agreement on 20 June 2019 (the initial Reference Shareholders Agreement, the first extension and the second extension collectively also referred to as the “Reference Shareholders Agreement”). The Reference Shareholders Agreement provided that it and all restrictions and requirements thereunder would terminate on 20 June 2021 unless extended by written agreement.
As such, on 29 April 2021, as part of the completion of the acquisition of the Borsa Italiana Group, CDP Equity and Intesa SanPaolo acceded to the Reference Shareholders Agreement by entering into the extension and amendment agreement with the Reference Shareholders (the “Extension Agreement”), and accordingly the letter agreement between Euronext and the Reference Shareholders was amended. One party left the group of Reference Shareholders. The Reference Shareholders Agreement, as extended and amended by the Extension Agreement, will terminate three years from completion, thus on 29 April 2024.
Name of reference shareholder Number of
sharesIndividual
shareholding
(% of capital)Caisse des Dépôts et Consignations 7,840,000 7.32% CDP Equity 7,840,000 7.32% Euroclear S.A./N.V. 4,284,252 4.00% Société Fédérale de Participations et d’Investissement/ Federale Participatie- en Investeringsmaatschappij 3,391,200 3.17% Intesa SanPaolo 1,606,594 1.50% ABN AMRO Bank N.V. through its subsidiary ABN AMRO Participaties Fund I B.V. 539,000 0.50% TOTAL SHAREHOLDING (a) 25,501,046 23.81% On 8 March 2024, an announcement was published confirming that Société Fédérale de Participations et d’Investissement, Caisse des Dépôts et Consignations and CDP Equity agreed with Euroclear S.A./N.V. to acquire from Euroclear S.A/N.V respectively 2,142,126, 535,531 and 535,531 shares in the share capital of Euronext N.V., representing respectively 2.0%, 0.5% and 0.5% of the share capital of the Company.
Under the Reference Shareholders Agreement, as amended on 29 April 2021, each of the Reference Shareholders has agreed not to sell or otherwise transfer or dispose of any of the Ordinary Shares such Reference Shareholder holds pursuant to the Share Purchase Agreement for a period of three years commencing on 29 April 2021(the “Restricted Period”). This transfer restriction does not apply to transfers to: (1) affiliates of a Reference Shareholder, provided that the transferee agrees to be bound by this transfer restriction and the other terms and conditions of the Reference Shareholders Agreement and shall accede to the Reference Shareholders Agreement; (2) another Reference Shareholder, provided that the Ordinary Shares transferred will continue to be subject to the transfer restriction and the other terms and conditions of the Reference Shareholders Agreement as if originally held by the acquiring Reference Shareholder; and (3) a third party with the unanimous consent in writing of the Reference Shareholders (subject to the consent of the relevant regulator(s)), such consent not to be unreasonably withheld and provided the third party shall accede to the Reference Shareholders Agreement, and further provided that no mandatory bid obligation is triggered by such transfer). In the event of transfers to an affiliate of a Reference Shareholder, such affiliate must re-transfer the relevant Ordinary Shares to the initial Reference Shareholder prior to ceasing to be an affiliate of such Reference Shareholder. In the event of proposed transfers to another Reference Shareholder, the other Reference Shareholders will have a right of first refusal pro rata to their respective holdings. In addition, repo and securities lending transactions may be excluded from this restriction on the basis of guidelines to be agreed.
■ ABN AMRO Bank N.V. and Intesa SanPaolo may each elect to leave the Reference Shareholders Agreement and other ancillary agreements during a 30-day period commencing on the date that is two years after the commencement of the Restricted Period by giving written notice to the other parties to the Reference Shareholders Agreement, provided that the remaining Reference Shareholders shall have a right to acquire all restricted Ordinary Shares held by the departing Reference Shareholder, pro rata to their respective holdings. Each of the remaining Reference Shareholders may also elect to appoint a third-party purchaser to acquire such restricted Ordinary Shares in accordance with these provisions. Any restricted Ordinary Shares not taken up by the remaining Reference Shareholders shall cease to be subject to these transfer restrictions. Such a departing Reference Shareholder may also elect to diminish the extent of its restricted Ordinary Shares after such two years. In that case, the same procedure will apply for the part of the interest the departing Reference Shareholder wants to exit; and ■ where an Emergency Event3 occurs in respect of any of the Reference Shareholders or any of its affiliates, the departing Reference Shareholder may elect to leave the Reference Shareholders Agreement and other ancillary agreements by giving written notice to the other parties to the Reference Shareholders Agreement, provided that the remaining Reference Shareholders shall have a right to acquire all restricted Ordinary Shares held by the departing Reference Shareholder, pro rata to their respective holdings. Each of the remaining Reference Shareholders may also elect to appoint a third party purchaser to acquire such restricted Ordinary Shares in accordance with these provisions. Any restricted Ordinary Shares not taken up by the remaining Reference Shareholders shall cease to be subject to these transfer restrictions. A departing Reference Shareholder may also elect to diminish the extent of its restricted Ordinary Shares in case of an Emergency Event. In that case, the same procedure will apply for the part of the interest the departing Reference Shareholder wants to exit. 3 an Emergency Event is a material action taken in respect of a member of the group of the departing Reference Shareholder as contemplated by the Bank Recovery and Resolution Directive or other similar action in respect of a member of the group of the departing Reference Shareholder.
Moreover, pursuant to the Reference Shareholders Agreement: (1) each Reference Shareholder has such number of votes equal to the aggregate number of restricted Ordinary Shares held by the Reference Shareholder and its affiliates. The restriction in the Reference Shareholders Agreement that no Reference Shareholder shall at any time have one-third or more of the votes within the Committee of Representatives of the Reference Shareholders regardless of the number of Ordinary Shares held will be removed; and (2) any resolution having a potential impact on the Company’s strategy and/or on the principles of the federal model and the business of the stock exchanges operated by the Combined Group will, in addition to the existing matters, require a qualified majority of two thirds of the votes cast.
The Reference Shareholders Agreement, as extended and amended, will terminate three years from completion of the Transaction.
Each of the Reference shareholders has agreed not to enter into any transaction or do anything, and not to permit its affiliates to enter into any transaction or do anything, if such transaction or action would result in the Reference shareholders or any of them becoming obligated or being forced to make a mandatory bid (verplicht openbaar bod) for the Ordinary Shares within the meaning of section 5:70 of the Dutch Wet op het financieel toezicht (Financial Supervision Act) implementing Article 5 of Directive 2004/25/EC.
The Reference shareholders, acting jointly, have the right to propose one third of the Supervisory Board members. Members of the Supervisory Board appointed upon nomination by the Reference shareholders are referred to as “Reference shareholder directors”. The Supervisory Board undertakes to nominate the person proposed by the Reference shareholders to the shareholders meeting of Euronext, absent its objection to such nomination on the grounds of the nominee reasonably not meeting the suitability and integrity criteria under applicable Dutch law and subject to any applicable regulatory assessments, approvals and requirements.
Reference shareholder directors are appointed by the General Meeting for four year terms. Should the Reference Shareholders Agreement terminate prior to the end of such term, the term shall end on the day following the next General Meeting of Euronext N.V.
Each Reference shareholder has appointed one representative and one alternate duly authorised to represent and act for and in the name of the relevant Reference shareholder and any and all of its affiliates for all purposes of the Reference shareholders Agreement, who shall be the contact person vis-à-vis the other Reference shareholders and the Company. The representatives of all Reference shareholders constitute the Committee of Representatives which decides on all matters requiring a joint decision of the Reference shareholders. The decisions of the Committee of Representatives shall be binding upon all Reference shareholders.
Other than as indicated below, the decisions of the Committee of Representatives are adopted by absolute majority of the votes cast. A qualified majority of two thirds of the votes cast is required as indicated below. Each Reference shareholder has a number of votes equal to the aggregate number of Ordinary Shares held by it and its affiliates, provided that no Reference shareholder shall have over one-third of the votes of the Committee of Representatives regardless of the number of Ordinary Shares it holds.
Whenever the Reference Shareholders Agreement requires joint decision making of the Reference shareholders in the General Meeting, each Reference shareholder will exercise and will cause any of its affiliates to exercise, its voting rights in such shareholders’ Meeting in accordance with the decision of the Committee of Representatives on the relevant subject.
The Reference shareholders agree to vote in accordance with the decision of the Committee of Representatives on any proposed shareholders’ resolutions.
■ any issuance of Ordinary Shares by the Company or rights to acquire Ordinary Shares (and exclusion or limitation or pre-emption rights, as the case may be); ■ any decrease in the share capital of the Company; ■ any authorisation for the Company to acquire its own shares; ■ any issuance of securities other than Ordinary Shares, to the extent these give exposure to Ordinary Shares, including but not limited to hybrids and covered bonds; ■ any proposal to appoint, suspend or remove any member of the Supervisory Board (including but not limited to any Reference shareholders director); ■ any going private transaction or other change of control of the Company; ■ any major identity transforming transactions requiring shareholders’ approval pursuant to section 2:107a of the Dutch Civil Code; ■ any other major acquisitions or disposals not requiring approval under section 2:107a of the Dutch Civil Code; ■ any amendment of the Articles of Association of the Company; and ■ any proposal for legal merger, demerger, conversion or dissolution of the Company. The Reference Shareholders Agreement and all restrictions and requirements thereunder or pursuant thereto shall terminate upon the earlier of (i) expiry of the Restricted Period (as defined in the ‘Transaction’ section below), unless extended by written agreement signed by all Reference shareholders, subject to any regulatory declarations of no objection or regulatory approvals, (ii) the Company entering into bankruptcy or being granted a (provisional) suspension of payment, and (iii) at any time after the Restricted Period, the aggregate shareholding of the Reference shareholders becoming less than 21% of the issued share capital of the Company unless increased to at least 21% again within 30 days after such event. The Reference Shareholders Agreement terminated on 21 June 2021.
In addition to the Reference Shareholders Agreement as amended and extended as set forth above, Euronext N.V. and the Reference Shareholders have entered into an agreement governing their relationship (the “Letter Agreement”). The initial Letter Agreement is dated 4 June 2014 and was supplemented on 25 March 2015 and amended and extended on 13 June 2017, and subsequently amended and extended on 17 June 2019. Simultaneously with the Extension Agreement, the Letter Agreement was amended on 29 April 2021 and extended in the context of the Transaction as defined below. The main purpose of the Letter Agreement is to enhance and reinforce the regular dialogue between Euronext and the Reference Shareholders, addressing (i) the right of the Reference Shareholders to retain one third of the Supervisory Board seats, (ii) the use by Euronext of the delegated authorities for the issuance / repurchase of shares, with the possible exclusion or restriction of pre-emption rights, (iii) the process of communication between Euronext and the Reference Shareholders, which includes periodical meetings on topics including strategy, governance and financing structure; and (iv) the involvement of the Reference shareholders in the selection procedure in case of any vacancies for the CEO, the COO or Supervisory Board positions.
-
6.5 General Meeting of Shareholders and Voting Rights
The Annual General Meeting must be held within six months after the end of each financial year. An Extraordinary General Meeting may be convened, whenever Euronext’s interests so require, by the Managing Board or the Supervisory Board. Shareholders representing alone or in aggregate at least one-tenth of Euronext’s issued and outstanding share capital may, pursuant to the Dutch Civil Code, request that a General Meeting be convened. Within three months of it becoming apparent to the Managing Board that Euronext’s equity has decreased to an amount equal to or lower than one-half of the paid-in and called-up capital, a General Meeting will be held to discuss any requisite measures.
Euronext will give notice of each General Meeting by publication on its website and in any other manner that Euronext may be required to follow in order to comply with and the applicable requirements of regulations pursuant to the listing of its shares on Euronext Amsterdam, Euronext Brussels, Euronext Lisbon and Euronext Paris. The notice convening any General Meeting must include, among other items, an agenda indicating the place and date of the meeting, the items for discussion and voting, the proceedings for registration including the registration date, as well as any proposals for the agenda. Pursuant to Dutch law, shareholders holding at least 3% of Euronext’s issued and outstanding share capital have a right to request the Managing Board and the Supervisory Board to include items on the agenda of the General Meeting. The Managing Board and the Supervisory Board must agree to these requests, provided that (i) the request was made in writing and motivated, and (ii) the request was received by the Chair of the Managing Board or the Chair of the Supervisory Board at least sixty days prior to the date of the General Meeting.
The Managing Board must give notice of a General Meeting, by at least such number of days prior to the day of the meeting as required by Dutch law, which is currently forty-two days.
Each shareholder (as well as other persons with voting rights or meeting rights) may attend the General Meeting, to address the General Meeting and, in so far as they have such right, to exercise voting rights pro rata to its shareholding, either in person or by proxy. Shareholders may exercise these rights, if they are the holders of shares on the registration date which is currently the 28th day before the day of the meeting, and they or their proxy have notified Euronext of their intention to attend the meeting in writing at the address and by the date specified in the notice of the meeting.
The Managing Board may decide that persons entitled to attend General Meetings and vote there may, within a period prior to the General Meeting to be set by the Managing Board, which period cannot start prior to the registration date, cast their vote electronically or by post in a manner to be decided by the Managing Board. Votes cast in accordance with the previous sentence are equal to votes cast at the meeting.
Each shareholder may cast one vote for each Ordinary Share held. Members of the Managing Board and the Supervisory Board may attend a General Meeting in which they have an advisory role. The voting rights attached to shares are suspended as long as such shares are held by Euronext. The rights of the holders of Ordinary Shares that were offered and sold in the Offering rank pari passu with each other and with all other holders of the Ordinary Shares, including the Reference shareholders, with respect to voting rights and distributions. Euronext has no intention of changing the rights of shareholders.
Resolutions of the General Meeting are taken by an absolute majority, except where Dutch law or Euronext’s Articles of Association provide for a qualified majority or unanimity.
The Annual General Meeting was held on 17 May 2023. In this meeting decisions were taken to adopt the 2022 Financial Statements, to declare a dividend of €2.22 per ordinary share, to discharge the members of the Managing Board and Supervisory Board in respect of their duties performed during the year 2022, to re-appoint Nathalie Rachou and Morten Thorsrud to the Supervisory Board, to re-appoint Stéphane Boujnah, Daryl Byrne, Chris Topple and Isabel Ucha to the Managing Board, to appoint Manuel Bento and Benoît van den Hove to the Managing Board, to appoint Ernst & Young Accountants LLP5 as the Company’s external auditors, and to designate the Managing Board as the competent body to 1) issue ordinary shares, 2) to restrict or exclude the pre-emptive rights of shareholders and 3) to acquire ordinary shares in the share capital of the Company on behalf of the Company.
5 Whose principal place of business is at Boompjes 258, 3011 XZ Rotterdam, the Netherlands. Ernst & Young Accountants LLP is registered at the Chamber of Commerce of Rotterdam in the Netherlands under number 24432944. The office address of the independent auditor of Ernst & Young Accountants LLP that signed the independent auditor’s report is Cross Towers, Antonio Vivaldistraat 150, 1083 HP Amsterdam, the Netherlands. The auditor signing the independent auditor’s reports on behalf of Ernst & Young Accountants LLP is a member of the Royal Netherlands Institute of Chartered Accountants (Koninklijke Nederlandse Beroepsorganisatie van Accountants).
-
6.7 Obligations of Shareholders and Members of the Managing Board to Disclose Holdings
Shareholders may be subject to notification obligations under the Dutch Financial Supervision Act. Pursuant to chapter 5.3 of the Dutch Financial Supervision Act, any person who, directly or indirectly, acquires or disposes of an actual or potential capital interest and/or voting rights in the Company must immediately give written notice to the AFM of such acquisition or disposal by means of a standard form if, as a result of such acquisition or disposal, the percentage of capital interest and/or voting rights held by such person reaches, exceeds or falls below the following thresholds: 3%, 5%, 10%, 15%, 20%, 25%, 30%, 40%, 50%, 60%, 75% and 95%. In addition, any person whose capital interest or voting rights reaches, exceeds or falls below a threshold due to a change in Euronext’s outstanding share capital, or in votes that can be cast on the shares as notified to the AFM by the Company, should notify the AFM no later than the fourth trading day after the AFM has published Euronext’s notification of the change in its outstanding share capital.
Each person holding an interest in Euronext’s share capital or voting rights of 3% or more at the time of admission of Euronext’s shares to trading must immediately notify the AFM. Furthermore, every holder of 3% or more of the Company’s share capital or voting rights whose interest at 31 December at midnight differs from a previous notification to the AFM must notify the AFM within four weeks.
For the purpose of calculating the percentage of capital interest or voting rights, the following interests must be taken into account: (i) shares and/or voting rights directly held (or acquired or disposed of) by any person, (ii) shares and/or voting rights held (or acquired or disposed of) by such person’s subsidiaries or by a third party for such person’s account or by a third party with whom such person has concluded an oral or written voting agreement, (iii) voting rights acquired pursuant to an agreement providing for a temporary transfer of voting rights in consideration for a payment, and (iv) shares and/or voting rights which such person, or any controlled entity or third party referred to above, may acquire pursuant to any option or other right to acquire shares and/or the attached voting rights.
Special rules apply to the attribution of shares and/or voting rights that are part of the property of a partnership or other form of joint ownership. A holder of a pledge or right of usufruct in respect of shares can also be subject to notification obligations, if such person has, or can acquire, the right to vote on the shares. The acquisition of (conditional) voting rights by a pledgee or beneficial owner may also trigger notification obligations as if the pledgee or beneficial owner were the legal holder of the shares and/or voting rights. Under the Dutch Financial Supervision Act, Euronext was required to file a report with the AFM promptly after the date of listing its shares setting out its issued and outstanding share capital and voting rights. Thereafter, Euronext is required to notify the AFM promptly of any change of 1% or more in its issued and outstanding share capital or voting rights since the previous notification. The AFM must be notified of other changes in Euronext’s issued and outstanding share capital or voting rights within eight days after the end of the quarter in which the change occurred. The AFM will publish all Euronext’s notifications of its issued and outstanding share capital and voting rights in a public register. If a person’s capital interest and/or voting rights reach, exceed or fall below the above-mentioned thresholds as a result of a change in Euronext’s issued and outstanding share capital or voting rights, such person is required to make a notification not later than on the fourth trading day after the AFM has published Euronext’s notification as described above.
Furthermore, each member of the Managing Board, the Supervisory Board and certain other persons who, inter alia, have (co-)managerial responsibilities in respect of the Company, as well as certain persons closely associated with any such members or other persons, must immediately give written notice to the AFM by means of a standard form of all shares and voting rights in Euronext held by him or her at the time of admission of Euronext’s shares to listing and thereafter of any change in his or her holding of shares and voting rights in Euronext.
-
6.8 Short Positions
Each person holding a net short position amounting to 0.2% or more of the issued share capital of a Dutch listed company must report it to the AFM. Each subsequent increase of this position by 0.1% above 0.2% will also have to be reported. Each net short position equal to 0.5% of the issued share capital of a Dutch-listed company and any subsequent increase of that position by 0.1% will be made public via the AFM short selling register. To calculate whether a natural person or legal person has a net short position, their short positions and long positions must be set off. A short transaction in a share can only be contracted if a reasonable case can be made that the shares sold can actually be delivered, which requires confirmation of a third party that the shares have been located. There is also an obligation to notify the AFM of gross short positions. The notification thresholds are the same as apply in respect of the notification of actual or potential capital interests in the capital and/or voting rights, as described above.
-
6.9 Market Abuse Regime
The Market Abuse Regulation (Regulation (EU) nr. 596/2014 (the “MAR”) and related Commission Implementing Regulations and Delegated Regulations, provide for specific rules that intend to prevent market abuse, such as the prohibitions on insider trading, divulging inside information and tipping, and market manipulation (the “European Union Market Abuse Rules”). Euronext is subject to the European Union Market Abuse Rules and non-compliance with these rules may lead to criminal fines, administrative fines, imprisonment or other sanctions.
The European Union Market Abuse Rules on market manipulation may restrict Euronext’s ability to buy back its shares. In certain circumstances, investors in Euronext can also be subject to the European Union Market Abuse Rules. Pursuant to Article 19 of the MAR (Managers’ transactions), members of the Managing Board, Supervisory Board and any senior executive who has regular access to inside information relating directly or indirectly to Euronext and has the power to take managerial decisions affecting the future developments and business prospects of Euronext, (persons discharging managerial responsibilities (PDMR’S); in case of Euronext Supervisory Board, Managing Board and permanent invitees to Managing Board meetings), must notify the AFM of every transaction conducted on their own account relating to the shares or debt instruments of Euronext or to derivatives or other financial instruments linked thereto.
In addition, certain persons closely associated with members of Euronext’s Managing Board or any of the other persons as described above and designated by the MAR PDMR’S must also notify the AFM of every transaction conducted on their own account relating to the shares or debt instruments of Euronext or to derivatives or other financial instruments linked thereto. The MAR determines the following categories of persons: (i) the spouse or any partner considered by national law as equivalent to the spouse, (ii) dependent children, (iii) other relatives who have shared the same household for at least one year at the relevant transaction date and (iv) a legal person, trust or partnership, the managerial responsibilities of which are discharged by a person discharging managerial responsibilities or by a person referred to in point (i), (ii) or (iii), which is directly or indirectly controlled by such a person, which is set up for the benefit of such a person, or the economic interests of which are substantially equivalent to those of such a person. These notifications must be made no later than on the third business day following the transaction date and by means of a standard form. The notification may be postponed until the moment that the value of the transactions performed for the PDMR that person’s own account, or transactions carried out by the persons closely associated with that person, reaches or exceeds an amount of €5,000 in the calendar year in question.
The AFM keeps a public register of all notifications under art. 19 of the MAR. Third parties can request to be notified automatically by e-mail of changes to the public register. Pursuant to the MAR, Euronext will maintain a list of its insiders. In addition, to further ensure compliance with MAR, Euronext has adopted an internal policy relating to the possession of and transactions by members of its PDMR’S and employees in Euronext shares or in financial instruments of which the value is (co)determined by the value of the shares. Euronext N.V. Insider Trading Policy has been published on its website on https://www.euronext.com/en/investors/corporate-governance.
-
6.10 Transparency Directive
After the admission to listing of its shares on Euronext Amsterdam, Euronext Brussels and Euronext Paris on 20 June 2014, and on Euronext Lisbon on 17 September 2014, Euronext became a listed public limited liability company (naamloze Vennootschap) incorporated and existing under the laws of the Netherlands. The Netherlands is Euronext’s home member state for the purposes of the Transparency Directive (Directive 2004/109/EC as most recently amended by Directive 2013/50/EU) as a consequence of which it is subject to the Dutch Financial Supervision Act in respect of certain on-going transparency and disclosure obligations upon admission to listing and trading of its shares on Euronext Amsterdam, Euronext Brussels, Euronext Lisbon and Euronext Paris.
-
6.11 Dutch Financial Reporting Supervision Act
The Dutch Financial Reporting Supervision Act (Wet toezicht financiële verslaggeving) (the “FRSA”) applies to financial years starting from 1 January 2006. On the basis of the FRSA, the AFM supervises the application of financial reporting standards by, among others, companies whose corporate seat is in the Netherlands and whose securities are listed on a Dutch Regulated Market or foreign stock exchange. Pursuant to the FRSA, the AFM has an independent right to (i) request an explanation from Euronext regarding its application of the applicable financial reporting standards and (ii) recommend to Euronext the making available of further explanations. If Euronext does not comply with such a request or recommendation, the AFM may request that the Enterprise Chamber order Euronext to (i) make available further explanations as recommended by the AFM, (ii) provide an explanation of the way it has applied the applicable financial reporting standards to its financial reports or (iii) prepare Euronext’s financial reports in accordance with the Enterprise Chamber’s instructions.
This Universal Registration Document also concerns the annual financial reporting within the meaning of 5:25c(2) of the Dutch Financial Supervision Act. The sections 1, 2, 3, 5, 6 and 7, as well as sections 4.1 and 4.2 concern the directors’ report within the meaning of 2:391 of the Dutch Civil Code, the statement of the Managing Board has been included in section 4.2.1 and the Financial Statements in section 8.
-
6.12 Dividends and Other Distributions
Euronext may make distributions to its shareholders only insofar as its shareholders’ equity exceeds the sum of the paid-in and called-up share capital plus the reserves as required to be maintained by Dutch law or by its Articles of Association. Under Euronext’s Articles of Association, the Managing Board decides which part of any profit will be reserved.
At the time of its IPO in 2014, Euronext’s dividend policy was established to achieve a dividend pay-out ratio of approximately 50% of net income, upon the approval of the Annual General Meeting, and as long as the Company is in position to pay this dividend while meeting all its various duties and obligations.
In October 2019, Euronext released its new strategic plan ‘Let’s Grow Together 2022’ and established a dividend policy over the duration of the plan consisting of distributing 50% of the reported net income, upon the approval of the Annual General Meeting, and as long as the Company is in position to pay this dividend while meeting all its various duties and obligation.
In November 2021, Euronext released its new strategic plan ‘Growth for Impact 2024’ and reiterated that the Group dividend policy would remain unchanged over the duration of the plan until 2024, consisting of distributing 50% of the reported net income, upon the approval of the Annual General Meeting, and as long as the Company is in position to pay this dividend while meeting all its various duties and obligation.
Following the early repayment of its previous term loan facility on 23 March 2017 (see section 7.1.11 - Facilities Agreement), and under the conditions of the new bank loan facility in which the Group entered on 18 July 2017, Euronext is no longer restricted to distributions, share repurchases or share redemptions. Repurchase of shares for the needs of the Employee Offering and employee shareholding and management incentive programs that Euronext may implement from time to time, which may be offered for free or at a discount and repurchase of shares in accordance with liquidity or market making programmes are not restricted within the Facilities Agreement.
Euronext may make a distribution of dividends to its shareholders only after the adoption of Euronext’s statutory annual accounts demonstrating that such distribution is legally permitted. The profit, as this appears from the adopted annual accounts, shall be at the free disposal of the General Meeting, provided that the General Meeting may only resolve on any reservation of the profits or the distribution of any profits pursuant to and in accordance with a proposal thereto of the Supervisory Board or a proposal of the Managing Board, which has been approved by the Supervisory Board. Resolutions of the General Meeting with regard to a distribution at the expense of the reserves shall require the approval of the Managing Board and the Supervisory Board.
The Managing Board is permitted to resolve to make interim distributions to Euronext shareholders, subject to approval of the Supervisory Board. The General Meeting may also resolve to make interim distributions to Euronext shareholders, pursuant to and in accordance with a proposal thereto by the Managing Board, which has been approved by the Supervisory Board.
The Managing Board may decide that, subject to approval of the Supervisory Board, a distribution on shares shall not be made in cash or not entirely made in cash but other than in cash, including but not limited in the form of shares in the Company or decide that shareholders shall be given the option to receive a distribution either in cash or other than in cash. The Managing Board shall, subject to approval of the Supervisory Board, determine the conditions under which such option can be given to Euronext’s shareholders.
Shareholders are entitled to share the profit pro rata to their shareholding. Claims to dividends and other distributions not made within five years from the date that such dividends or distributions became payable will lapse, and any such amounts will be considered to have been forfeited to Euronext (verjaring).
-
6.13 2024 Financial Calendar
-
7 OPERATING AND FINANCIAL REVIEW |DR|
The following review relates to Euronext historical financial condition and results of operations for the years ended 31 December 2023, 2022 and 2021. This “Operating and Financial Review” is based on the audited Financial Statements for the years ended 31 December 2023, 2022 and 2021, which are included or incorporated by reference in this Registration Document and should be read in conjunction with “General description of the Company” and “Financial Statements”. Prospective investors should read the entire Universal Registration Document and not just rely on the information set out below. All financial information included in this “Operating and Financial Review” has been extracted from the audited Consolidated Financial Statements.
The following discussion of Euronext results of operations and financial condition contains forward-looking statements. Euronext actual results could differ materially from those that are discussed in these forward-looking statements. Factors that could cause or contribute to such differences include those discussed below and elsewhere in this Registration Document, particularly under “Risk Factors”.
7.1 Overview
Euronext is a pan-European exchange group, offering a diverse range of products and services and combining transparent and efficient equity, fixed income securities and derivatives markets in Amsterdam, Bergen, Brussels, Dublin, Lisbon, Milan, Oslo and Paris. Euronext businesses comprise: listing, cash trading, derivatives trading, fixed income trading, spot FX trading, power trading, investor services, advanced data services, post-trade and technologies & other.
Euronext management reviews the performance of the business, and makes decisions on allocation of resources, only on a company-wide basis. Therefore, Euronext has one reportable segment.
Euronext has been operating as an independent, publicly traded company since 20 June 2014. Prior to June 2014, Euronext’s businesses were part of ICE as a result of ICE’s acquisition of NYSE Euronext on 13 November 2013.
7.1.1 Definitions
“Legacy Euronext” means the historical operations of the former Euronext N.V. (existing prior to 15 March 2014) and its subsidiaries, including LIFFE.
Segments are reported in a manner consistent with how the business is operated and reviewed by the chief operating decision maker (CODM), who is responsible for allocating resources and assessing performance of the operating segments. The chief operating decision maker of the Group is the Extended Managing Board, comprising the Managing Board and permanent attendees of Senior Management. The organisation of the Group reflects the high level of mutualisation of resources across geographies and product lines. Operating results are monitored on a group-wide basis and, accordingly, the Group represents one operating segment and one reportable segment. Operating results reported to the Extended Managing Board are prepared on a measurement basis consistent with the reported Consolidated Statement of Profit or Loss.
In presenting and discussing the Group’s financial position, operating results and net results, management uses certain Alternative performance measures not defined by IFRS. These Alternative performance measures (APMs) should not be viewed in isolation as alternatives to the equivalent IFRS measures and should be used as supplementary information in conjunction with the most directly comparable IFRS measures. Alternative performance measures do not have standardised meaning under IFRS and therefore may not be comparable to similar measures presented by other companies. Euronext believes that these measures provide valuable supplemental information to the company’s management, investors and other stakeholders to evaluate the company’s performance.
-
7.2 Material Contracts and Related Party Transactions
7.2.1 Material contracts
The major contracts for Euronext, entered into the ordinary course of business, but essential for its activity as holding a regulated markets operators and CSDs and investment firms, are:
▪ the Derivatives Clearing Agreements with LCH SA for the clearing of trades executed on Euronext derivatives markets; ▪ The post-trade services agreements with CBOE Clear Europe for the clearing of trades executed on Euronext cash markets under the open access model; ▪ the clearing agreement signed with SIX X-Clear for the clearing of trades executed on Oslo Børs cash market; ▪ the clearing agreements signed with CBOE Clear Europe for the clearing of trades executed on Oslo Børs cash market; ▪ the clearing agreements signed with LCH Ltd for the clearing of trades executed on Oslo Børs cash market; ▪ the clearing agreements signed with NASDAQ Clearing for the clearing of trades executed on Fish Pool; ▪ the agreement related to the interoperability link between Euronext Clearing (CC&G) and LCH SA: Service agreement for Allied Clearing House of the LCH Clearnet SA System; ▪ the Master Services agreement signed with Aruba S.p.A., a company operating in data centre services; ▪ the IT Outsourced agreement signed with Nexi for the custody services provided to Euronext Securities Milan; ▪ the agreement governing Mainframe outsourcing services and CO-location services for Distributed systems for Euronext Securities Oslo with Tietoevry Norway AS; ▪ the Separation Framework Agreement with SSC Global Business Services (LSEG) for the provision of Millennium trading platform and related ancillary services to Borsa Italiana; -
7.3 Legal Proceedings
The Group is involved in a number of legal proceedings that have arisen in the ordinary course of our business. Other than as discussed below in sections 7.3.1 there are no governmental, legal or arbitration proceeding that might have or have had in the recent past significant effects on the Group’s financial position or profitability.
Management does not expect these pending or threatening legal proceedings to have a significant effect on the Group’s financial position or profitability. The outcome of legal proceedings, however, can be extremely difficult to predict and the final outcome may be materially different from management’s expectations.
7.3.1 Euronext Amsterdam pension fund
In the court case between Euronext Amsterdam and approximately 120 retired and/or former Euronext Amsterdam employees, united in an association (“VPGE”), the Higher Court ordered Euronext to restore the pension reduction to the VPGE members and to pay for indexation of the VPGE member’s pensions on 28 July 2020. Euronext lodged an appeal in Cassation before the Supreme Court on 23 October 2020.
On 29 October 2021, the Attorney General (“Advocaat-Generaal”) advised the Supreme Court to annul the decision of the Higher Court and to reject the cross-appeal filed by VPGE. On 23 September 2022, the Supreme Court has overturned the verdict of the Higher Court. The Supreme Court agreed with Euronext’s position on all points raised.
-
7.4 Insurance
Euronext maintains a comprehensive insurance programme with the assistance of an insurance broker allowing Euronext to make an assessment of its risks, take out the proper insurance policies and deal with insurance management as smoothly as possible.
■ the main insurance policies are consolidated at the Euronext group level in order to ensure consistency of coverage across the Euronext group and to benefit from lower premiums; ■ the scope of risks covered is determined by reference to Euronext’s activities (listing, trading, market data, post-trade and technologies & other); and ■ all insurance carriers are analysed from a credit rating perspective. ■ directors’ & officers’ liability: this policy covers losses related to an alleged wrongful Act committed by members of Euronext Managing Board, Euronext Supervisory Board and other senior management. Under this policy, any of Euronext past, present or future directors or officers will be insured against liability for negligence, default or breach of duty or other liability, other than cases of wilful misconduct or gross negligence (opzet of grove nalatigheid); ■ professional indemnity & crime: this policy provides first party coverage and indemnification against third-party claims arising out of negligence, errors or omissions in connection with professional services or failure to meet contractual obligations in the conduct of exchange activities and exchange related activities. This policy also covers first party losses resulting directly from dishonest or fraudulent acts committed by Euronext employees or third parties working with Euronext employees; ■ cyber: this policy provides coverage for an Euronext’s business interruption following malicious action on an IT system. Coverage is provided for claims arising from the interruption of systems or other failures of IT Security caused by damage to computer programs or data that results from a computer attack or unauthorised access or use of system. This policy also covers claims for the failure to protect personality identifiable information or unauthorised disclosure of confidential corporate information in any form; ■ property damage & business interruption: this policy provides first party coverage for losses to Euronext’s property or business interruption. The coverage includes tenant’s liability and liability to third parties; ■ terrorism; and ■ commercial general liability: this policy provides coverage for negligent acts and/or omissions resulting in bodily injury, property damage, consequential losses and pure financial losses to third parties, their reputation, or their property as a result of using Euronext products and services. In addition to the insurance program, risk management and business continuity plan policy and procedures are implemented in a complementary manner. Euronext believes that its existing insurance coverage, including the amounts of coverage and the conditions, provides reasonable protection, taking into account the costs for the insurance coverage and the potential risks to business operations.
-
7.5 Liquidity and Capital Resources
7.5.1 Liquidity
Euronext’s financial policy seeks to finance the growth of the business, remunerate shareholders and ensure financial flexibility, while maintaining strong creditworthiness and liquidity.
Euronext primary sources of liquidity are cash flows from operating activities, current assets and existing bank facilities. Euronext’s principal liquidity requirements are for working capital, capital expenditures and general corporate use.
Euronext business is becoming more diversified and thus less dependent upon the levels of activity in its exchanges, and in particular upon the volume of financial instruments traded, the number of shares outstanding of listed issuers, the number of new listings, the number of traders in the market and similar factors. As a result of this diversification away from the activities to which Euronext has no direct control, the volatility of revenue has reduced. While Euronext activities are not subject to significant seasonal trends, cash flows vary from month to month due to Euronext billing and collection efforts (most notably the annual billings for listed companies during the first quarter).
Euronext business has historically generated significant cash flow from operating activities to meet its cash requirements as well as to distribute dividends to its shareholders. Euronext expects future cash flow from operating activities to be sufficient to fund its capital expenditures, distribute dividends as well as repay its debts as they become due. In addition, Euronext has access to a €600 million revolving credit facility (see section 7.1.11 - Facilities Agreements and Bonds).
Because of its strict financial policy of maintaining strong creditworthiness and liquidity, and its significant operating cash flow generation capacities, Euronext N.V. considers its financial position as at 31 December 2023 as solid, both from a solvency and a liquidity perspective.
-
7.6 Tangible Fixed Assets
7.6.1 Principal properties
Euronext’s headquarters are located in Amsterdam, the Netherlands at Beursplein 5, and in Paris, France, at La Défense (92054), 14 Place des Reflets. Euronext’s registered office is located at Beursplein 5, 1012 JW Amsterdam, the Netherlands.
Real estate Euronext - per 31 December 2023 Location / Building Address ZIP City Country Lease
commenceLease
expirySurfaces
(sqm)Owned
/ LeasedAmsterdam, BEURSPLEIN 5 5 Beursplein 1012 JW Amsterdam Netherlands N/A N/A 14,450 Owned London (expires March’ 24) 110 Cannon Street EC4N6EU London UK 2017 2024 1,085 Leased London 25 North Colonnade E14 5HS London UK 2023 2030 1,083 Leased Brussels / LE MARQUIS 1 rue de Marquis 1000 Brussels Belgium 2014 2030 860 Leased Lisbon / VICTORIA-Seuros vida 196-7 Avenida da Liberdade 1250-147 Lisbon Portugal 2018 2026 554 Leased Porto / Euronext Securities / Euronext Technologies 3433 Avenida da Boavista 410-138 Porto Portugal 2016 2026 3,448 Leased Paris / PRAETORIUM 14 place des Reflets 92054 Paris Cedex France 2015 2033 10,339 Leased SCI Frepillon 7 Rue Louis Bleriot 93350 Frepillon France 2022 2025 282 Leased CCI Nantes 6 rue Bisson 44000 Nantes France 2020 2025 15 Leased SCI Lyon 52 Rue de la Republique 69002 Lyon France 2022 2025 58 Leased Regus Marseille 165 Avenue du Prado 13008 Marseille Cedex France 2019 2024 13 Leased Spain / REGUS / Cuzco IV 141 Paseo de Castellana - 5 floor 28046 Madrid Spain 2017 2024 12 Leased New York 180 Maiden Lane NY10038 New York USA 2016 2026 854 Leased Bengalore/ Obeya 17 Cross Road, AJ Forte 560102IN Bengalore India 2022 2024 308 Leased Dublin Exchange building Foster Place 2 Dublin Ireland N/A N/A 1,525 Owned Stock Exchange Anglesea Street Dublin Ireland N/A N/A 1,330 Owned Oslo Børs Tollbugata 2 Oslo Norway N/A N/A 3,004 Owned Fishpool Bergen Fantoftvegen 38 Bergen Norway 2019 2024 140 Leased Euronext Securities Copenhagen Nicolai Eightveds Gade 8 Copenhagen Denmark 2022 2028 3,097 Leased Palazzo Mezzanotte1 6 Piazza Affari Milan Italy 2018 2024 12,305 Leased Gatelab Viale dei Pentrei Isernia Italy 2018 2024 440 Leased Euronext Clearing/ MTS 146 Via Tomacelli Rome Italy 2019 2025 1,636 Leased iBabs (expires April ’24) De Factorij 33 Zwaag Netherlands 2016 2024 292 Leased iBabs Maelsonstraat 28 Hoorn Netherlands 2023 2031 339 Leased Company Webcast Rivium Boulevard 176 Rotterdam Netherlands 2014 2024 1,136 Leased Nordpool Oslo Lilleakerveien 2 AS Oslo Norway N/A 2029 2,024 Leased Nordpool Stockholm Västra Järvägsgatan 111 Stockholm Sweden 2019 2024 45 Leased Nordpool Helsinki Keilasatama 2150 Helsinki Finland 2022 2027 693 Leased Singapore 7 Straits View Singapore Singapore 2019 2024 27 Leased Delhi / We Work Udyhog Vihar Pahse 4R Gurugram India 2022 2024 18 Leased Netherlands/ Company Webcast Strawinskylaan 47 1077XW Amsterdam Netherlands 2018 2024 97 Leased London/ Company Webcast 16-18 Finsbury Circus EC2M7FEB London United Kingdom 2021 2031 156 Leased Brusels/ Company Webcast 1, rue du marquis 1000 Brussels Belgium 2017 2025 96 Leased Paris/ Company Webcast 8, place de l’Opéra 75009 Paris CEDEX France 2020 2029 112 Leased Italy/ Company Webcast 20, Via Agnello 20121 Milan Italy 2022 2026 165 Leased Germany/ Company Webcast Bockenheimer Landstrasse 23 60323 Frankfurt am Main Germany 2022 2029 219 Leased -
8 FINANCIAL STATEMENTS
8.1 Consolidated Statement of Profit or Loss
Year ended
31 December 2023Year ended
31 December 2022In thousands of euros (except per share data) Note Underlying
itemsNon-
Underlying
items (a)Total Underlying
itemsNon-
Underlying
items (a)Total Revenue 8 1,426,876 – 1,426,876 1,418,774 – 1,418,774 Net treasury income through CCP business 8 46,660 – 46,660 44,038 (48,951) (4,913) Other income 8 1,171 – 1,171 4,949 – 4,949 Total revenue and income 1,474,707 – 1,474,707 1,467,761 (48,951) 1,418,810 Salaries and employee benefits 9 (319,485) (12,931) (332,416) (301,059) (5,958) (307,017) Depreciation and amortisation 10 (74,215) (95,916) (170,131) (68,829) (91,362) (160,191) Other operational expenses 11 (290,556) (65,367) (355,923) (305,085) (21,259) (326,344) Operating profit 790,451 (174,214) 616,237 792,788 (167,530) 625,258 Finance costs 13 (35,683) (31) (35,714) (37,078) – (37,078) Finance income (b) 13 30,526 – 30,526 5,806 – 5,806 Other net financing results (b) 13 5,208 – 5,208 (691) – (691) Results from equity investments 14 23,500 – 23,500 9,842 – 9,842 (Loss)/gain on disposal of subsidiaries 14 – (206) (206) – 2,274 2,274 Gain on sale of associates 14 – 53,028 53,028 – – – Share of net profit/(loss) of associates and joint ventures accounted for using the equity method, and impairments thereof 7 6,533 – 6,533 10,360 (1,526) 8,834 Profit before income tax 820,535 (121,423) 699,112 781,027 (166,782) 614,245 Income tax expense 15 (208,925) 46,228 (162,697 (208,321) 44,716 (163,605) Profit for the period 611,610 (75,195) 536,415 572,706 (122,066) 450,640 Profit attributable to: - Owners of the parent 584,674 (71,107) 513,567 555,308 (117,481) 437,827 - Non-controlling interests 26,936 (4,088) 22,848 17,398 (4,585) 12,813 Basic earnings per share 27 5.51 (0.67) 4.84 5.21 (1.10) 4.10 Diluted earnings per share 27 5.50 (0.67) 4.83 5.19 (1.10) 4.10 (a) Details of non-underlying items are disclosed in Note 12. (b) As from 2023, the Group presents finance income separately on the face of the income statement, following increased income from interest calculated using the effective interest method. The Group re-presented the comparative period accordingly by reclassifying €5.8 million from ‘Other net financing results’ that was originally reported at €5.1 million in 2022. -
8.2 Consolidated Statement of Comprehensive Income
Year ended In thousands of euros Note 31 December
202331 December
2022Profit for the period 536,415 450,640 Other comprehensive income
Items that may be reclassified to profit or loss:
- Exchange differences on translation of foreign operations (57,822) (29,371) - Income tax impact on exchange differences on translation of foreign operations 19 6,253 2,773 - Change in value of debt investments at fair value through other comprehensive income 7,099 (40,346) - Realisation of fair value changes upon disposal of debt investments – 48,951 - Income tax impact on change in value of debt investments at fair value through other comprehensive income 19 (2,046) (2,426) Items that will not be reclassified to profit or loss:
- Change in value of equity investments at fair value through other comprehensive income 11,865 42,054 - Income tax impact on change in value of equity investments at fair value through other comprehensive income 19 (3,061) (8,469) - Remeasurements of post-employment benefit obligations 30 (1,366) 11,896 - Income tax impact on remeasurements of post-employment benefit obligations 19 190 (1,329) Other comprehensive income for the period, net of tax (38,888) 23,733 Total comprehensive income for the period 497,527 474,373 Comprehensive income attributable to:
- Owners of the parent 475,703 461,989 - Non-controlling interests 21,824 12,384 -
8.3 Consolidated Balance Sheet
In thousands of euros Note As at 31 December
2023As at 31 December
2022Assets
Non-current assets
Property, plant and equipment
16 114,373 109,389 Right-of-use assets 17 55,739 42,290 Goodwill and other intangible assets 18 6,108,152 6,205,826 Deferred tax assets 19 31,258 18,917 Investments in associates and joint ventures 7 1,329 72,009 Financial assets at fair value through other comprehensive income 20,35 262,655 278,219 Financial assets at amortised cost 35 3,452 2,312 Other non-current assets 1,088 1,374 Total non-current assets 6,578,046 6,730,336 Current assets
Trade and other receivables
21 303,515 318,087 Other current assets 22 30,128 27,585 Income tax receivables 58,563 54,931 CCP clearing business assets 35 183,715,218 166,842,539 Other current financial assets 24 103,053 162,740 Cash and cash equivalents 25 1,448,788 1,001,082 Total current assets 185,659,265 168,406,964 Total assets 192,237,311 175,137,300 Equity and liabilities
Equity
Issued capital
26 171,370 171,370 Share premium 2,432,426 2,432,426 Reserve own shares (242,117) (32,836) Retained earnings 1,543,458 1,265,765 Other reserves 40,554 77,242 Shareholders’ equity 3,945,691 3,913,967 Non-controlling interests 139,655 126,339 Total equity 4,085,346 4,040,306 Non-current liabilities
Borrowings
29 3,031,629 3,027,161 Lease liabilities 17 37,314 21,648 Deferred tax liabilities 19 531,895 552,574 Post-employment benefits 30 22,677 19,631 Contract liabilities 33 60,029 63,785 Provisions 31 7,295 7,049 Total non-current liabilities 3,690,839 3,691,848 Current liabilities
Borrowings
29 17,286 17,370 Lease liabilities 17 22,159 28,466 Derivative financial instruments 23 34 19 CCP clearing business liabilities 35 183,832,245 166,858,684 Current income tax liabilities 89,120 28,463 Trade and other payables 32 415,843 396,287 Contract liabilities 33 79,270 75,198 Provisions 31 5,169 659 Total current liabilities 184,461,126 167,405,146 Total equity and liabilities 192,237,311 175,137,300 -
8.4 Consolidated Statement of Cash Flows
Year ended In thousands of euros Note 31 December
202331 December
2022Profit before income tax 699,112 614,245 Adjustments for:
• Depreciation and amortisation
10 170,131 160,191 • Share based payments 9 14,378 13,994 • Results from equity investments (a) 14 (23,496) (9,840) • Gain on sale of associates 14 (53,028) – • Share of profit from associates and joint ventures, and impairments thereof 7 (6,533) (8,834) • Changes in working capital and provisions (a) 155,495 67,366 Cash flow from operating activities 956,059 837,122 Income tax paid
(129,986) (220,636) Net cash generated by operating activities 826,073 616,486 Cash flow from investing activities
Acquisition of associates
– (654) Acquisition of business combinations, net of cash acquired 5 (2,513) (65,988) Acquisition of equity investments (1,326) – Proceeds from disposal of equity investments 240 – Purchase of other current financial assets (72,280) (30,599) Redemption of other current financial assets 155,494 42,900 Proceeds from disposal of subsidiaries (b) (208) 8,743 Proceeds from sale of associates 122,444 – Purchase of property, plant and equipment 16 (27,703) (31,867) Purchase of intangible assets 18 (75,333) (67,650) Interest received (c) 25,261 5,889 Dividends received from equity investments 14 23,496 9,840 Dividends received from associates 7 7,820 6,748 Proceeds from sale of property, plant and equipment and intangible assets – 53 Net cash (used in) investing activities 155,392 (122,585) Cash flow from financing activities
Interest paid (28,711) (29,565) Settlement of derivatives financial instruments – (8,886) Dividends paid to the company’s shareholders 26 (237,191) (205,985) Dividends paid to non-controlling interests (5,347) (10,931) Payment of lease liabilities 17 (28,423) (23,417) Transactions in own shares 26 (219,061) (18) Employee Share transactions (967) (3,566) Net cash generated by financing activities (519,700) (282,368) Net (decrease)/increase in cash and cash equivalents 461,765 211,533 Cash and cash equivalents - Beginning of the period 1,001,082 809,409 Non-cash exchange (losses)/gains on cash and cash equivalents (14,059) (19,860) Cash and cash equivalents - End of the period 1,448,788 1,001,082 (a) In prior periods, the Group adjusted for results from equity investments in the line ‘Changes in working capital and provisions’. As per 2023, the Group has changed its presentation and adjusts for ‘Results from equity investments’ in a separate line item. The Group re-presented the comparative period accordingly by reclassifying €9.8 million from ‘Changes in working capital and provisions’ that was originally reported at €57.5 million in 2022. (b) The current period included a settlement payment of €0.2 million related to the finalisation of the sale of MTS Markets International Inc. at end of last year. (c) The Group has re-presented ‘interest received’ as part of cash flows from investing activities, whereas in previous periods this item was presented as part of cash flows from financing activities. -
8.5 Consolidated Statement of Changes in Equity
Other reserves In thousands of euros Note Issued capital Share premium Reserve own
sharesRetained
EarningsForeign currency
translation
reserveFair value
reserve of
financial assets
at FVOCITotal other
reservesTotal
Shareholders’
equityNon-controlling
interestsTotal equity Balance as at 1 January 2022 171,370 2,432,426 (42,778) 1,022,921 (10,631) 74,278 63,647 3,647,586 123,114 3,770,700 Profit for the period – – – 437,827 – – – 437,827 12,813 450,640 Other comprehensive income for the period – – – 10,567 (26,169) 39,764 13,595 24,162 (429) 23,733 Total comprehensive income for the period – – – 448,394 (26,169) 39,764 13,595 461,989 12,384 474,373 Transfer of revaluation result to retained earnings – – – – – – – – – – Issuance of common stock – – – – – – – – – – Share based payments – – – 13,976 – – – 13,976 – 13,976 Dividends paid – – – (205,985) – – – (205,985) (8,990) (214,975) Transactions in own shares 26 – – (18) – – – – (18) – (18) Acquisition of non–controlling interest – – – – – – – – – – Non-controlling interests on acquisition/(disposal) of subsidiary – – – – – – – – (169) (169) Other movements – – 9,960 (13,541) – – – (3,581) – (3,581) ‘Balance as as 31 December 2022 171,370 2,432,426 (32,836) 1,265,765 (36,800) 114,042 77,242 3,913,967 126,339 4,040,306 Profit for the period – – – 513,567 – – – 513,567 22,848 536,415 Other comprehensive income for the period – – – (1,176) (50,545) 13,857 (36,688) (37,864) (1,024) (38,888) Total comprehensive income for the period – – – 512,391 (50,545) 13,857 (36,688) 475,703 21,824 497,527 Share based payments – – – 14,134 – – – 14,134 – 14,134 Dividends paid – – – (237,191) – – – (237,191) (6,881) (244,072) Transactions in own shares 26 – – (219,061) – – – – (219,061) – (219,061) Acquisition of non-controlling interest – – – (885) – – – (885) (1,627) (2,512) Non–controlling interests on acquisition/(disposal) of subsidiary – – – – – – – – – – Other movements – – 9,780 (10,756) – – – (976) – (976) Balance as at 31 December 2023 171,370 2,432,426 (242,117) 1,543,458 (87,345) 127,899 40,554 3,945,691 139,655 4,085,346 -
Notes to the Consolidated Financial Statements
Euronext N.V. (“the Group” or “the Company”) is a public limited liability company incorporated and domiciled at Beursplein 5, 1012 JW, Amsterdam in the Netherlands under Chamber of Commerce number 60234520 and is listed on the following Euronext local markets: Euronext Amsterdam, Euronext Brussels, Euronext Lisbon and Euronext Paris.
The Group operates securities and derivatives exchanges in Continental Europe, Ireland and Norway. It offers a full range of exchange- and corporate services, including security listings, cash and derivatives trading, and market data dissemination. It combines the Amsterdam, Brussels, Dublin, Lisbon, Milan, Oslo and Paris exchanges in a highly integrated, cross-border organisation. The Group also operates Interbolsa S.A. (Euronext Securities Porto), Verdipapirsentralen ASA (Euronext Securities Oslo), VP Securities AS (Euronext Securities Copenhagen) and Monte Titoli S.p.A. (Euronext Securities Milan) (respectively the Portuguese, Norwegian, Danish and Italian national Central Securities Depositories (CSDs)) and Cassa di Compensatione e Garanzia S.p.A. (Euronext Clearing), a fully owned Italian multi-asset clearing house.
The Group further owns Euronext FX Inc., a US-based Electronic Communication Network in the spot foreign exchange market, and has majority stakes in Nord Pool, a leading power market in Europe offering intraday and day-ahead trading in the physical energy markets, and MTS S.p.A., a leading trading platform for European government bonds.
The Group’s in-house IT function supports its exchange operations. In addition, the Group provides software licenses as well as IT development, operation and maintenance services to third-party exchanges.
These Consolidated Financial Statements were authorised for issuance by Euronext N.V.’s Supervisory Board on 28 March 2024 and will be submitted for adoption by the Annual General Meeting (AGM) of Shareholders on 15 May 2024. The AGM has the power to amend the Consolidated Financial Statements after issue.
The financial position and performance of the Group was particularly affected by the following events and transactions that have occurred during the year:
During the first weeks of January 2023, Euronext local boards decided to terminate the Derivatives Clearing Agreement with LCH SA. On 16 January 2023, a termination notice was sent to LCH SA. The Group recognised a payable for the termination fees and migration fees (including indexation) indicated in the agreement of approximately €36.6 million. The amount was recognised as a non-underlying expense (see Note 12). The amount will be due in January 2024.
Following the notification of the early termination of the Derivatives Clearing Agreement, LCH Group Ltd. had the option to buy back Euronext’s 11.1% stake in LCH SA, which it executed on 21 June 2023.
On 26 June 2023, the Group entered into a definitive agreement for the sale of its 11.1% stake in LCH SA to LCH Group Ltd., for an amount of €111.0 million, which was valued by independent valuation experts.
The completion of the transaction (transfer of all risks and rewards related to the shares) occurred on 6 July 2023. Subsequently, the Group derecognised its investment in associate LCH SA at its carrying amount of €69.4 million and recognised a €41.6 million ‘non-underlying’ gain on sale of associate in the consolidated income statement (see Notes 12 and 14).
On 1 December 2023, the Group sold its interest in associate Tokeny S.a.r.l. for an amount of €11.4 million. As the investment was held at a carrying amount of zero, the full proceeds of the sale were recognised as a gain on sale of associate in the income statement (see Note 14).
In 2023, the Group finalised the purchase price allocation of the technology businesses of Nexi S.p.A., that the Group had acquired on 1 December 2022 at a purchase consideration of approximately €57 million (on a debt free, cash free basis). The Group identified €10.1 million of software intangible assets and €3.2 million of customer relationships as part of the purchase price allocation, which were subsequently offset in goodwill (see Notes 5 and 18).
On 9 June 2023, the Group announced that it would repurchase 330,000 of its own shares as part of its Long-Term Incentive plans (see Note 26). This repurchase programme was implemented and directed by an independent agent from 12 June 2023 to 7 July 2023 and was carried out in accordance with the conditions of the authorisation granted by the General Meeting of Shareholders of Euronext on 17 May 2023.
On 27 July 2023, the Group announced a share repurchase programme (the ‘Programme’) for an amount of €200 million. The Programme was implemented as follows:
■ Purpose: the purpose of the Programme is to reduce the share capital of the Group. All shares repurchased as part of the Programme will be cancelled; ■ Maximum amount allocated: €200 million; ■ Duration: the targeted period for the Programme is from 31 July 2023 for a maximum duration of a year, to be implemented on Euronext Paris; ■ Framework: Euronext aims to repurchase approximately 3.0% of its ordinary shares, as authorised by the General Meeting on 17 May 2023 to a limit of 10.0%. Euronext entered into a non-discretionary arrangement with a financial intermediary to conduct the repurchase.
The Programme was executed in compliance with applicable rules and regulations, including the Market Abuse Regulation 596/2014 and the Commission Delegated Regulation (EU) 2016/1052, and based on the authority granted by the annual general meeting of shareholders on 17 May 2023.
For the determination of fair value of its direct and indirect investments in Euroclear S.A./N.V., the Group applied a weighted approach of the Gordon Growth model and recent observed market transactions taking into account an illiquidity discount for the limited number of transactions. This valuation method resulted in a total valuation of Euroclear S.A./N.V. of €5.3 billion and to an increase in fair value of Euronext S.A./N.V.’s direct- and indirect investments of €11.7 million as per 31 December 2023. This revaluation was recorded in Other Comprehensive Income.
On 22 May 2023, a Long-Term Incentive plan (“LTI 2023”) was established under the revised Remuneration Policy that was approved by the AGM in May 2021. The LTI cliff vests after 3 years whereby performance criteria will impact the actual number of shares at vesting date. The share price for this grant at grant date was €66.60 and 257,436 Restricted Stock Units (“RSU’s”) were granted. The total share-based payment expense at the vesting date in 2026 is estimated to be €13.6 million. As from the grant date, compensation expense recorded for this LTI 2023 plan amounted to €2.6 million in the income statement for the year ended 31 December 2023.
On 17 May 2023, at the Annual General Meeting, the Group appointed Benoît van den Hove as Member of the Managing Board of Euronext N.V. with effect from 1 July 2023, following the announced retirement of Vincent Van Dessel. At that same meeting, Manuel Bento was appointed as Member of the Managing Board of Euronext N.V. with immediate effect.
On 8 November 2023, Simon Gallagher was appointed CEO of Euronext London, Head of Global Sales and Member of the Managing Board of Euronext N.V., subject to shareholders’ and regulatory approvals. This as a result of Chris Topple stepping down from his roles at Euronext.
The accounting policies applied in the preparation of these Consolidated Financial Statements are set out below. These policies have been consistently applied to all the years presented, unless stated otherwise. The financial statements for the year ended 31 December 2023 are for the Group consisting of Euronext N.V. and its subsidiaries.
The Consolidated Financial Statements of the Group have been prepared in accordance with International Financial Reporting Standards (IFRS) adopted by the European Union. They also comply with the financial reporting requirements included in Title 9 Book 2 of the Dutch Civil Code, as far as applicable.
The Consolidated Financial Statements have been prepared on a historical cost basis, unless stated otherwise. They have also been prepared on the basis that the Group will continue to operate as a going concern.
These Consolidated Financial Statements include the financial results of all subsidiaries in which entities in the Group have a controlling financial interest and it also incorporates the share of results from associates and joint ventures. The list of individual legal entities which together form the Group, is provided in Note 4. All transactions and balances between subsidiaries have been eliminated on consolidation. All transactions and balances with associates and joint ventures are reflected as related party transactions and balances (see Note 36).
Subsidiaries are all entities controlled by the Group. The Group controls an entity when the Group is exposed to, or has rights to, variable returns from its involvement with the entity and has the ability to affect those returns through its power to direct the activities of the entity. Subsidiaries are fully consolidated from the date on which control is transferred to the Group. They are de-consolidated from the date that control ceases.
Intergroup transactions, balances and unrealised gains and losses on transactions between companies within the Group are eliminated upon consolidation unless they provide evidence of impairment. Accounting policies of subsidiaries have been changed where necessary to ensure consistency with the policies adopted by the Group.
Non-controlling interest in the results and equity of subsidiaries are shown separately in the consolidated statement or profit or loss, statement of comprehensive income, statement of changes in equity and balance sheet respectively.
Associates are entities over which the Group has the ability to exercise significant influence, but does not control. Generally, significant influence is presumed to exist when the Group holds 20% to 50% of the voting rights in an entity. Joint arrangements are joint operations or joint-ventures over which the Group, together with another party or several other parties, has joint control. Investments in associates and joint ventures are accounted for using the equity method of accounting.
Under the equity method of accounting, the investments are initially recognised at cost and adjusted thereafter to recognise the group’s share of the post-acquisition profits or losses of the investee in profit or loss, and the group’s share of movements in other comprehensive income of the investee in other comprehensive income. Dividends received or receivable from associates and joint ventures are recognised as a reduction in the carrying amount of the investment. When the group’s share of losses in an equity-accounted investment equals or exceeds its interest in the entity, including any other unsecured long-term receivables, the group does not recognise further losses, unless it has incurred obligations or made payments on behalf of the other entity. Unrealised gains on transactions between the group and its associates and joint ventures are eliminated to the extent of the group’s interest in these entities. Unrealised losses are also eliminated unless the transaction provides evidence of an impairment of the asset transferred. Accounting policies of equity accounted investees have been changed where necessary to ensure consistency with the policies adopted by the group. The carrying amount of equity-accounted investments is tested for impairment.
Business combinations are accounted for using the acquisition method. The cost of an acquisition is measured as the aggregate of the consideration transferred, which is measured at acquisition date fair value, and the amount of any non-controlling interests in the acquiree. For each business combination, the Group elects whether to measure the non-controlling interests in the acquiree at fair value or at the proportionate share of the acquiree’s identifiable net assets. Acquisition-related costs are expensed as incurred and included in administrative expenses.
The Group determines that it has acquired a business when the acquired set of activities and assets include an input and a substantive process that together significantly contribute to the ability to create outputs. When the Group acquires a business, it assesses the financial assets and liabilities assumed for appropriate classification and designation in accordance with the contractual terms, economic circumstances and pertinent conditions as at the acquisition date. The identifiable assets acquired and liabilities are measured initially at their fair values at the acquisition date. Contingent consideration is classified either as equity or as a financial liability. Amounts classified as a financial liability are subsequently re-measured to fair value with changes in fair value recognised in profit or loss.
The consideration transferred is measured at the fair value of any assets transferred, liabilities incurred and equity interests issued. The excess of the consideration transferred over the fair value of the Group’s share of the identifiable net assets acquired is recorded as goodwill. To the extent applicable, any non-controlling interest in the acquiree and the acquisition-date fair value of any previous equity interest in the acquiree are added to consideration transferred for purposes of calculating goodwill. Goodwill is initially measured at cost. After initial recognition, goodwill is measured at cost less any accumulated impairment losses.
For the purpose of impairment testing, goodwill acquired in a business combination is, from the acquisition date, allocated to each of the Group’s cash-generating units that are expected to benefit from the combination, irrespective of whether other assets or liabilities of the acquiree are assigned to those units. Where goodwill has been allocated to a cash-generating unit (CGU) and part of the operation within that unit is disposed of, the goodwill associated with the disposed operation is included in the carrying amount of the operation when determining the gain or loss on disposal. Goodwill disposed in these circumstances is measured based on the relative values of the disposed operation and the portion of the cash-generating unit retained.
Segments are reported in a manner consistent with how the business is operated and reviewed by the chief operating decision maker (CODM), who is responsible for allocating resources and assessing performance of the operating segments. The chief operating decision maker of the Group is the Extended Managing Board, comprising the Managing Board and permanent attendees of Senior Management. The organisation of the Group reflects the high level of mutualisation of resources across geographies and product lines. Operating results are monitored on a group-wide basis and, accordingly, the Group represents one operating segment and one reportable segment. Operating results reported to the Extended Managing Board are prepared on a measurement basis consistent with the reported Consolidated Statement of Profit or Loss.
In presenting and discussing the Group’s financial position, operating results and net results, management uses certain Alternative performance measures not defined by IFRS. These Alternative performance measures (APMs) should not be viewed in isolation as alternatives to the equivalent IFRS measures and should be used as supplementary information in conjunction with the most directly comparable IFRS measures. APMs do not have standardised meaning under IFRS and therefore may not be comparable to similar measures presented by other companies. The Group measures performance based on EBITDA1, as management believes that this measurement is most relevant in evaluating the operating results of the Group. This measure is included in the internal management reports that are reviewed by the CODM.
Reference is made to one of the below definitions, whenever the term ‘EBITDA’ is used throughout these Consolidated Financial Statements:
■ EBITDA1: ‘Underlying’ operating profit before ‘underlying’ depreciation and amortisation (D&A), taking into account the lines described in the Consolidated Statement of Profit or Loss; ■ EBITDA2: Profit before (i) interest expense, (ii) tax, (iii) any share of the profit of any associated company or undertaking, except for dividends received in cash by any member of the Group, (iv) non-underlying items included in operating profit excluding D&A; and (v) depreciation and amortisation; ■ EBITDA3: EBITDA as defined in the Share Purchase Agreements of the acquired companies involved. These Consolidated Financial Statements are presented in Euro (EUR), which is the Group’s presentation currency. The functional currency of each Group entity is the currency of the primary economic environment in which the entity operates.
Foreign currency transactions are converted into the functional currency using the rate ruling at the date of the transactions. Foreign exchange gains or losses resulting from the settlement of such transactions and from the translation at year-end rates of monetary assets and liabilities denominated in foreign currencies are recognised in the Income Statement.
Exceptions to this are where the monetary items form part of the net investment in a foreign operation or are designated as hedges of a net investment, in which case the exchange differences are recognised in Other Comprehensive Income.
The results and financial position of Group entities that have a functional currency different from the presentation currency are converted into the presentation currency as follows:
■ assets and liabilities (including goodwill) are converted at the closing balance sheet rate. ■ income and expenses are translated at average exchange rates (unless this is not a reasonable approximation of the cumulative effect of the rates prevailing on the transaction dates, in which case income and expenses are translated at the dates of the transactions); and ■ all resulting exchange differences are recognised as currency translation adjustments within Other Comprehensive Income. Property, plant and equipment is carried at historical cost, less accumulated depreciation and any accumulated impairment loss. The cost of purchased property, plant and equipment is the value of the consideration given to acquire the assets and the value of other directly attributable costs. All repairs and maintenance costs are charged to expense as incurred.
Property, plant and equipment is depreciated on a straight-line basis over the estimated useful lives of the assets, except land and construction in process assets, which are not depreciated. The estimated useful lives, which are reviewed annually and adjusted if appropriate, used by the Group in all reporting periods presented are as follows:
The Group recognises right-of-use assets at the commencement date of the lease (i.e., the date the underlying asset is available for use). Right-of-use assets are measured at cost less any accumulated depreciation and if necessary any accumulated impairment. The cost of a right-of-use asset comprise the present value of the outstanding lease payments, any lease payments made at or before the commencement date less any lease incentives received, any initial direct costs and an estimate of costs to be incurred in dismantling or removing the underlying asset. If the lease transfers ownership of the underlying asset to the lessee at the end of the lease term or if the cost of the right-of-use asset reflects that the lessee will exercise a purchase option, the right-of-use asset is depreciated to the end of the useful life of the underlying asset. Otherwise the right-of-use asset is depreciated to the end of the lease term.
At the commencement date of the lease, the Group recognises lease liabilities measured at the present value of lease payments to be made over the lease term. The lease payments include fixed payments (including in-substance fixed payments) less any lease incentives receivable, variable payments that depend on an index or rate and amounts expected to be paid under residual value guarantees. The lease payments also include the exercise price of a purchase option reasonably certain to be exercised by the Group and payments for penalties for terminating a lease, if the lease term reflects the Group exercising the option to terminate. Variable lease payments that do not depend on an index or a rate are recognised as expense in the period on which the event or condition that triggers the payment occurs. In this context, the Group also applies the practical expedient that the payments for non-lease components are generally recognised as lease payments. In calculating the present value of lease payments, the Group uses the incremental borrowing rate at the lease commencement date if the interest rate implicit in the lease is not readily determinable. After the commencement date, the amount of lease liabilities is increased to reflect the accretion of interest and reduced for the lease payments made. In addition, the carrying amount of lease liabilities is remeasured if there is a modification, a change in the lease term, a change in the in-substance fixed lease payments or a change in the assessment to purchase the underlying asset.
The Group applies the short-term lease recognition exemption to leases that have a lease term of 12 months or less from the commencement date and do not contain a purchase option. It also applies the lease of low-value assets recognition exemption to leases of office IT equipment and other staff equipment that are of low value. Lease payments on short-term leases and leases of low-value assets are recognised as expense on a straight-line basis over the lease term.
Goodwill represents the excess of the consideration transferred in a business combination over the Group’s share in the fair value of the net identifiable assets and liabilities of the acquired business at the date of acquisition. Goodwill is not amortised but is tested at least annually for impairment, or whenever an event or change in circumstances indicate a potential impairment.
For the purpose of impairment testing, goodwill arising in a business combination is allocated to the cash-generating units (CGUs) or groups of CGUs that are expected to benefit from the synergies of the combination. Each CGU or CGU Group to which goodwill is allocated represents the lowest level within the Group at which the goodwill is monitored for internal management purposes.
The carrying value of a CGU Group is compared to its recoverable amount, which is the higher of its value in use and its fair value less costs of disposal. Impairment losses on goodwill are not subsequently reversed. Value in use is derived from the discounted future free cash flows of the CGU Group. Fair value less costs of disposal is based on discounted cash flows and market multiples applied to forecasted earnings. Cash flow projections are based on budget and business plan approved by management and covering a 2-year period in total. Cash flows beyond the business plan period are extrapolated using a perpetual growth rate. Key assumptions used in goodwill impairment test are described in Note 18.
An intangible asset is an identifiable non–monetary asset without physical substance. Such an asset is identifiable when it is separable, or when it arises from contractual or other legal rights.
Software development costs are capitalised only from the date when all of the following conditions are met:
Capitalised software development costs are amortised on a straight-line basis over their useful lives, generally from 2 to 7 years. Other development expenditures that do not meet these criteria, as well as software maintenance and minor enhancements, are expensed as incurred.
Other intangible assets, which are acquired by the Group, are stated at cost less accumulated amortisation and accumulated impairment losses (if applicable). The estimated useful lives are as follows:
Assets that are subject to amortisation and depreciation are reviewed for impairment whenever events or circumstances indicate that the carrying amount may not be recoverable. Assets that have an indefinite useful life are not subject to amortisation nor depreciation and are tested at least annually for impairment. An impairment loss is recognised for the amount by which the asset’s carrying amount exceeds its recoverable amount. The recoverable amount is the higher of an asset’s fair value less costs to sell or value in use. For purposes of assessing impairment, assets are grouped into Cash Generating Units (CGUs). A CGU is the smallest identifiable group of assets that generates cash inflows that are largely independent from other groups of assets. Non-financial assets, other than goodwill, that were previously impaired are reviewed for possible reversal of the impairment at each reporting date.
The Group uses derivative financial instruments, such as forward currency contracts and interest rate swaps, to hedge its foreign currency risk and interest rate risks. Such derivative financial instruments are initially recognised at fair value on the date on which a derivative contract is entered into and are subsequently remeasured at fair value. Derivatives are carried as financial assets when the fair value is positive and as financial liabilities when the fair value is negative.
For the purpose of hedge accounting, hedges are classified as fair value hedges when hedging the exposure to changes in the fair value of a recognised asset or liability or an unrecognised firm commitment.
At the inception of a hedge relationship, the Group formally designates and documents the hedge relationship to which it wishes to apply hedge accounting and the risk management objective and strategy for undertaking the hedge.
The documentation includes identification of the hedging instrument, the hedged item, the nature of the risk being hedged and how the Group will assess whether the hedging relationship meets the hedge effectiveness requirements (including the analysis of sources of hedge ineffectiveness and how the hedge ratio is determined). A hedging relationship qualifies for hedge accounting if it meets all of the following effectiveness requirements:
• There is ‘an economic relationship’ between the hedged item and the hedging instrument. • The effect of credit risk does not ‘dominate the value changes’ that result from that economic relationship. • The hedge ratio of the hedging relationship is the same as that resulting from the quantity of the hedged item that the Group actually hedges and the quantity of the hedging instrument that the Group actually uses to hedge that quantity of hedged item. The hedges relevant to the Group, that meet all the qualifying criteria for hedge accounting are accounted for, as described below:
The change in the fair value of a hedging instrument is recognised in the statement of profit or loss. The change in the fair value of the hedged item attributable to the risk hedged is recorded as part of the carrying value of the hedged item and is also recognised in the statement of profit or loss.
For fair value hedges relating to items carried at amortised cost, any adjustment to carrying value is amortised through profit or loss over the remaining term of the hedge using the Effective Interest Rate (EIR) method. The EIR amortisation may begin as soon as an adjustment exists and no later than when the hedged item ceases to be adjusted for changes in its fair value attributable to the risk being hedged.
If the hedged item is derecognised, the unamortised fair value is recognised immediately in profit or loss.
The classification depends on the Group’s business model for managing the financial instruments and the contractual terms of the cash flows. For instruments measured at fair value, gains and losses will either be recorded in profit or loss or Other Comprehensive Income. For investments in equity instruments that are not held for trading, this will depend on whether the group has made an irrevocable election at the time of initial recognition to account for the equity investment at fair value through Other Comprehensive Income (FVOCI).
Financial assets and financial liabilities are initially recognised on their settlement date. Except for trade receivables, at initial recognition the Group measures a financial asset at its fair value plus, in the case of a financial asset not at fair value through profit or loss (FVPL), transaction costs that are directly attributable to the acquisition of the financial asset. Transaction costs of financial assets carried at FVPL are expensed in profit or loss. Financial assets with embedded derivatives are considered in their entirety when determining whether their cash flows are solely payment of principal and interest. Trade receivables are initially measured at their transaction price if they do not contain a significant financing component in accordance with IFRS 15.
Assets that are held for collection of contractual cash flows where those cash flows represent solely payments of principal and interest are measured at amortised cost. Interest income from these financial assets is measured using the effective interest rate method and is shown in finance income. Any gain or loss arising on de-recognition is recognised directly in profit or loss and presented in other net financing results, together with foreign exchange gains and losses. Impairment losses are presented as separate line item in the statement of profit or loss, if material.
The Group’s financial assets at amortised cost include the Group’s trade and other receivables, loans and deposits included under (non-current) Financial assets at amortised cost, short-term deposits with a maturity of more than three months included under other current financial assets and cash and cash equivalents.
For financial assets from CCP clearing business all measurement effects are shown in net treasury income through CCP business.
This category includes clearing member trading balances relating to certain collateralised transactions, other receivables from clearing members of the CCP business and clearing member cash and cash equivalents, representing amounts received from the clearing members to cover initial and variation margins and default fund contributions that are not invested in bonds.
Debt instruments that are held for collection of contractual cash flows and for selling the financial assets, where the assets’ cash flows represent solely payments of principal and interest, are measured at FVOCI. Movements in the carrying amount are taken through Other Comprehensive Income, except for the recognition of impairment gains or losses, interest income and foreign exchange gains and losses which are recognised in profit or loss. When the financial asset is derecognised, the cumulative gain or loss previously recognised in Other Comprehensive Income is reclassified from equity to profit or loss. Interest income from these financial assets is included in finance income using the effective interest rate method. Foreign exchange gains and losses are presented in other net financing results and impairment expenses are presented as separate line item in the statement of profit or loss, if material. The Group’s debt instruments at FVOCI include the Group’s investments in short-term listed bonds and government bonds (long-term and short-term) linked to Euronext Clearing’s own funds.
Where the Group’s management has elected to present fair value gains and losses on equity investments in Other Comprehensive Income, there is no subsequent reclassification of fair value gains and losses to profit or loss following the de-recognition of the investment. Dividends from such investments will be recognised in profit or loss as results from equity investments when the Group’s right to receive payments is established, except when the Group benefits from such proceeds as a recovery of part of the cost of the financial asset, in which case, such gains are recorded in Other Comprehensive Income. The Group elected to classify irrevocably its unlisted equity securities that are held as long-term strategic investments that are not expected to be sold in the foreseeable future in this category.
This category includes the investments made in (predominantly) government bonds, that are funded by the margins and default funds deposited by members of the CCP clearing business. These investments are recognised in ‘CCP clearing business assets’. Interest income and reclassified fair value gains/(losses) from these financial assets are shown in net treasury income through CCP business.
Assets that do not meet the criteria for amortised cost or FVOCI are measured at FVPL. Changes in the fair value of financial assets at FVPL are recognised in other net financing results in the statement of profit or loss as applicable.
This category includes clearing member trading balances comprising derivatives, equity and debt instruments that are marked to market on a daily basis. In particular these include open transactions not settled at the reporting date on the derivatives market in which Euronext Clearing operates as a central counterparty. The fair valuation of such positions is determined on the market price of each individual financial instrument at closing of the reporting period.
As the amounts of clearing member trading assets and liabilities at FVPL are equally entered in both assets and liabilities, the fair valuation of both items does not lead to any net profit or loss in the income statement of the Group.
Liabilities that are held for trading are measured at FVPL. Changes in the fair value of financial liabilities at FVPL are recognised in other net financing results in the statement of profit or loss as applicable.
This category includes clearing member trading balances comprising derivatives, equity and debt instruments that are marked to market on a daily basis. In particular these include open transactions not settled at the reporting date on the derivatives market in which Euronext Clearing operates as a central counterparty. The fair valuation of such positions is determined on the market price of each individual financial instrument at closing of the reporting period.
As the amounts of clearing member trading assets and liabilities at FVPL are equally entered in both assets and liabilities, the fair valuation of both items does not lead to any net profit or loss in the income statement of the Group.
Financial liabilities that are not held for trading are generally accounted for at amortised cost. These instruments are measured using the effective interest rate method and interest expense is shown in finance costs. The Group’s financial liabilities at amortised cost include the Group’s trade and other payables, borrowings and lease liabilities.
For financial liabilities from CCP clearing business all measurement effects are shown in net treasury income through CCP business. This category includes as well CCP repurchase agreements and other payables to clearing members related to initial and variation margins and default fund contributions.
The Group recognises an allowance for expected credit losses (ECLs) for all debt instruments not held at fair value through profit or loss. ECLs are based on the difference between the contractual cash flows due in accordance with the contract and all the cash flows that the Group expects to receive, discounted at an approximation of the original effective interest rate. The expected cash flows will include cash flows from the sale of collateral held or other credit enhancements that are integral to the contractual terms.
ECLs are recognised in two stages. For credit exposures for which there has not been a significant increase in credit risk since initial recognition, ECLs are provided for credit losses that result from default events that are possible within the next 12-months (a 12-month ECL). For those credit exposures for which there has been a significant increase in credit risk since initial recognition, a loss allowance is required for credit losses expected over the remaining life of the exposure, irrespective of the timing of the default (a lifetime ECL).
For trade and contract receivables, the Group applies a simplified approach in calculating ECLs. Therefore, the Group does not track changes in credit risk, but instead recognises a loss allowance based on lifetime ECLs at each reporting date. The Group has established a provision matrix that is based on its historical credit loss experience, adjusted for forward-looking factors specific to the debtors and the economic environment.
Impairment losses (and reversal of impairment losses) on equity investments measured at FVOCI are not reported separately from other changes in fair value.
Further disclosures relating to impairment of financial assets are also provided in Note 37.5. Generally, the Group considers a financial asset in default when contractual payments are 90 days past due. However, in certain cases, the Group may also consider a financial asset to be in default when internal or external information indicates that the Group is unlikely to receive the outstanding contractual amounts. A financial asset is written off when there is no reasonable expectation of recovering the contractual cash flows.
Financial assets and liabilities are offset and only the net amount is presented in the consolidated balance sheet when there is a legally enforceable right to offset the recognised amounts and there is an intention to settle on a net basis or to realise the asset and settle the liability simultaneously.
Trade receivables are amounts due from customers for services performed in the ordinary course of business. They are generally due for settlement within 30 days and therefore are all classified as current. Trade receivables are recognised initially at the amount of consideration that is unconditional unless they contain significant financing components, when they are recognised at fair value. The Group holds the trade receivables with the objective to collect the contractual cash flows and therefore measures them subsequently at amortised cost using the effective interest method, less loss allowance.
At Nord Pool all trades are settled on the day of trading or on the following business day, with invoices and credit notes being dispatched in the afternoon. Financial settlement is due one working day after trading for net buyers and two working days after trading for net sellers. Variations in settlement cycle following variations in working days combined with variations in physical power prices traded on Nord Pool markets can give rise to significant fluctuations in trade receivables from period to period.
Cash and cash equivalents comprise cash at banks, highly liquid investments with original maturities of three months or less and investments in money market funds that are readily convertible to known amounts of cash and are subject to insignificant risk of changes in value.
Borrowings are initially recorded at the fair value of proceeds received, net of transaction costs. Subsequently, these liabilities are carried at amortised cost, and interest is charged to profit or loss over the period of the borrowings using the effective interest method. Accordingly, any difference between the proceeds received, net of transaction costs, and the redemption value is recognised in profit or loss over the period of the borrowings using the effective interest rate method. Fees paid on the establishment of loan facilities are recognised as transaction costs of the loan to the extent that it is probable that some or all of the facility will be drawn down. In this case, the fee is deferred until the draw down occurs. To the extent there is no evidence that it is probable that some or all of the facility will be drawn down, the fee is capitalised as a prepayment for liquidity services and amortised over the period of the facility to which it relates.
Provisions are recognised when the Group has a present legal or constructive obligation as a result of past events; it is probable that an outflow of resources will be required to settle the obligation; and the amount can be reliably estimated. Restructuring provisions primarily comprise employee termination payments. Provisions are not recognised for future operating losses, unless there is an onerous contract. Provisions are measured at the present value of the expenditures expected to be required to settle the obligation using a pre-tax risk-free discount rate. The increase in the provision due to passage of time is recognised as interest expense.
An onerous contract is a contract in which the unavoidable costs of meeting the obligations under the contract exceed the economic benefits expected to be received under it. The unavoidable costs under a contract reflect the least net cost of exiting from the contract, which is the lower of the cost of fulfilling it or any compensation or penalties arising from failure to fulfil it.
Trade payables are obligations to pay for goods or services that have been acquired in the ordinary course of business. Trade and other payables are recognised initially at fair value and subsequently measured at amortised cost using the effective interest method.
At Nord Pool all trades are settled on the day of trading or on the following business day, with invoices and credit notes being dispatched in the afternoon. Financial settlement is due one working day after trading for net buyers and two working days after trading for net sellers. Variations in settlement cycle following variations in working days combined with variations in physical power prices traded on Nord Pool markets can give rise to significant fluctuations in trade payables from period to period.
The Group operates defined benefit pension schemes and defined contribution pension schemes. When the Group pays fixed contributions to a pension fund or pension insurance plan and the Group has no legal or constructive obligation to make further contributions, if the fund’s assets are insufficient to pay all pension benefits, the plan is considered to be a defined contribution plan. In that case, contributions are recognised as employee expense when they become due.
For the defined benefit schemes, the net asset or liability recognised on the balance sheet comprises the difference between the present value of the defined benefit pension obligation and the fair value of plan assets. A net asset is recognised only to the extent the Group has the right to effectively benefit from the plan surplus. The service cost, representing benefits accruing to employees in the period, and the net interest income or expense arising from the net defined benefit asset or liability are recorded within operating expenses in the Statement of Profit or Loss. Actuarial gains and losses arising from experience adjustments, changes in actuarial assumptions or differences between actual and expected returns on assets are recognised in equity as a component of Other Comprehensive Income. The impact of a plan amendment, curtailment or settlement is recognised immediately when it arises in profit or loss.
Certain employees of the Group participate in Euronext’s share-based compensation plans. Awards granted by Euronext under the plans are restricted stock units (RSUs). Under these plans, Euronext receives services from its employees as consideration for equity instruments of the group. As the awards are settled in shares of Euronext N.V., they are classified as equity settled awards.
The share-based compensation reflected in the Statement of Profit or Loss relates to the RSUs granted by Euronext to the Group’s employees. The equity instruments granted do not vest until the employee completes a specified period of service, typically three years. The grant-date fair value of the equity settled RSUs is recognised as compensation expense over the required vesting period, with a corresponding credit to equity.
Euronext has performance share plans, under which shares are conditionally granted to certain employees. The fair value of awards at grant date is calculated using market-based pricing, i.e. the fair value of Euronext shares. This value is expensed over their vesting period, with a corresponding credit to equity. The expense is reviewed and adjusted to reflect changes to the level of awards expected to vest, except where this arises from a failure to meet a market condition or a non-vesting condition in which case no adjustment applies.
The Group reacquires its own equity instruments. Those instruments (‘treasury shares’) are deducted from equity. No gain or loss is recognised in profit or loss on the purchase, sale, issue or cancellation of an entity’s own equity instruments. Such treasury shares may be acquired and held by the entity or by other members of the consolidated group. Consideration paid or received is recognised directly in equity.
The Group is in the business of providing a diverse range of products and services combining transparent and efficient equity, fixed income securities and derivatives markets. The Group’s main businesses comprise listing, cash trading, derivatives trading, fixed income trading, spot FX trading, power trading, market data and indices, post-trade and market solutions & other. Revenue from contracts with customers is recognised when control of the good and services are transferred to the customer at an amount that reflects the consideration to which the Group expects to be entitled in exchange for those goods or services. The Group has generally concluded that, except for the revenue sharing agreement with Intercontinental Exchange (ICE), it is principal in its revenue arrangements because it typically controls the goods or services before transferring them to the customer.
The disclosures of significant accounting judgements, estimates and assumptions relating to revenue from contracts with customers are provided in section ‘Critical accounting estimates and assumptions’.
Listing fees primarily consist of original listing fees paid by issuers to list securities on the various cash markets (admission fees), subsequent admission fees for other corporate actions (such as admission of additional securities) and annual listing fees paid by companies whose financial instruments are listed on the cash markets. The admission services around initial (and subsequent) admission and its directly related corporate action services are considered activities that the Group needs to undertake to enable the customer to be listed. These activities are combined with the ongoing listing services and are used as inputs to produce the combined output, which is the service of being listed. Consequently, revenue generated from this combined performance obligation is recognised based on time elapsed over the listing period, as this best reflects the continuous transfer of the listing services.
Corporate services revenues are earned from webcast solutions, board portal solutions, insider list management solutions and investor relationship management solutions. For corporate services that are provided to customers under an access license, revenue is recognised evenly over the contractual period of the license, as this best reflects the continuous benefit from the license by the customer throughout this period. For corporate services that are provided to customers on an event basis or under a ‘right-to-use’ license, revenue will be recognised at the point in time of the event or acceptance of the license.
The Group earns cash trading fees for customer orders of equity securities and other cash instruments on the Group’s cash markets, earns derivative trading fees for the execution of trades of derivative contracts on the Group’s derivative markets and earns fixed income trading fees for the execution of trades of debt securities on the Group’s fixed income markets. Spot FX trading fees are earned for execution of trades of foreign exchange contracts on the FastMatch markets. Power trading fees are earned for execution of trades on Nord Pool’s day ahead and intraday physical energy markets. Customers obtain control over the service provided at execution of the trade. Revenue is recognised at that point in time.
Membership and subscription fees for the Borsa Italiana Group markets are generally paid in advance on the first day of the membership or subscription period. The Group recognises revenue on a straight-line basis over the period to which the fee relates, as this best reflects the extent of the Group’s progress towards completion of the performance obligation under the contract.
The Group charges clients on a per-user basis for the access to its real-time and proprietary market data information services. The Group also collects periodic license fees from clients for the right to distribute the Group data to third parties. Customers obtain control over the market data service provided during the period over which it has access to the data. Consequently revenue is recognised based on time elapsed over the market data access period, as the Group meets its obligation to deliver data consistently throughout this period.
The Group generates indices revenues from Index licensing fees, which gives customers the right to apply Euronext Index Trademark names in their products and ETFs. The nature of an index-license is considered a distinct ‘right-to-access’ license as the customer can reasonably expect the Group to undertake ongoing activities to support and maintain the value of its trademark names. Revenue generated from these licenses are therefore recognised evenly over the contractual period of the license, as this best reflects the continuous benefit from the license by the customer throughout this period.
Post-trade revenue primarily include clearing, settlement and custody fees. Clearing fees are recognised when the clearing of the trading transaction is completed. Customers obtain control over the service provided at completion of clearing the securities, which is the only performance obligation. Revenue is recognised at that point in time. The Group earns clearing fees through the activities from its own clearing house CC&G SPA (Euronext Clearing) and through an agreement with LCH S.A. in which the latter is providing clearing service as a service provider, executing the service under control of the Group. The nature of the promise is the execution of a cleared trade on the Group’s trading platforms. The Group controls the services that are derived from that promise, before it is transferred to the customer. This makes the Group the principal in the transaction of providing clearing services to its customers and consequently the Group recognises its clearing revenue on a gross basis.
Settlement fees are recognised when the settlement of the trading transaction is completed. Customers obtain control over the service provided at completion of the settlement of the securities, which is the only performance obligation. Revenue is recognised at that point in time. Custody fees are recognised as the service of holding the customer’s securities in custody is performed. Revenue is recognised based on time elapsed over that period of time, as this best reflects the continuous transfer of services.
Euronext Technologies and other revenue include software license and maintenance services, IT (hosting) services provided to third-party market operators, connection services and data centre colocation services provided to market participants, and other revenue.
Software licenses that are distinct can be considered a ‘right-to-use’ license, given the significant stand-alone functionality of the underlying intellectual property. Consequently revenue will be recognised at the point in time of acceptance of the software and the source code by the customer. For software licenses that are combined with a significant modification service, revenues are recognised over time, using the input method of labour hours spend during the significant modification period, as the Group has no alternative use for these combined performance obligations and would have an enforceable right to payment for performance completed to date. Revenue from software maintenance services are recognised evenly over the maintenance agreement period, as this best reflects the continuous transfer of maintenance services throughout the contract period.
The Group delivers hosting services to customers that are using the software installed in the Euronext data centre to use the Group’s trading platforms. Installation services provided before the start of a hosting service do not include significant client customisation of the software installed in the Euronext data centre. The installation service itself does not transfer a good or service to the customer, but are required to successfully transfer the only performance obligation for which the customer has contracted, which is the hosting service. Revenue generated from this performance obligation is recognised evenly over the full service period of the hosting contract, as this best reflects the continuous transfer of hosting services to the customer.
Part of the connection services and data centre colocation services are provided under a revenue sharing agreement with Intercontinental Exchange (ICE). Euronext is providing ICE the right to provide services directly to Euronext customers, to which Euronext provides a continuous customer access to the relevant Euronext Group markets and as such, Euronext is arranging for the specified services to be provided by another party as an agent. Euronext customers connect to its markets via the ICE SFTI® network or rent colocation space in the ICE data centres that house Euronext’s trading platforms. ICE receives fees from Euronext customers over the period of access to the SFTI® network and over the colocation rental period. The Group recognises its revenue share over that same period of time, using the practical expedient provided in IFRS 15.B16 that allows an entity to recognise revenue in the amount to which it has the right to invoice. The entitled amount that Euronext invoices to ICE corresponds directly with the value that Euronext’s performance obligation has to ICE, which equals to the agreed commission.
As from the data centre migration in June 2022, revenues for connection services and data centre colocation services are also generated from Euronext’s core data centre facility in Bergamo. Fees received for these services are recognised evenly over the customer’s access period and colocation rental period, as this best reflects the continuous transfer of these services.
The Group also generates revenue from other connection services that trading members are using primarily for the purpose of placing their cash and derivatives trading orders. Members enter into contracts that generate access availability for placing trading orders (the active logon session). Customers obtain control over the service provided during the period of access to their active logon session. Revenue is recognised evenly over that period of time, as this best reflects the continuous transfer of technology services.
Income recognised in the CCP clearing businesses includes net treasury income earned on margin and default funds, held as part of the risk management process. Net treasury income is the result of interest earned on cash assets lodged with the clearing house, less interest paid to the members on their margin and default fund contributions. Net treasury income is shown separately from the Group’s revenues on the face of the income statement to distinguish this income stream from revenues arising from other activities and provide a greater understanding of the operating activities of the Group. Where negative interest rates apply, the Group recognises interest paid on cash assets as a treasury expense and interest received on clearing members’ margin as treasury income.
Other income is income not attributable to the typical business model of the Group. Other income primarily consists of transitional income from services provided by Borsa Italiana Group to London Stock Exchange Group (LSEG) to facilitate the transition of ownership following the acquisition of Borsa Italiana Group.
A receivable represents the Group’s right to an amount of consideration that is unconditional (i.e., only the passage of time is required before payment of the consideration is due from the customer). The Group refers to billed receivables as trade receivables, whereas unbilled receivables are referred to as contract receivables by the Group.
A contract liability is the obligation to transfer goods or services to a customer for which the Group has received consideration (or an amount of consideration is due) from the customer. If a customer pays consideration before the Group transfers goods or services to the customer, a contract liability is recognised when the payment is made or the payment is due (whichever is earlier). Contract liabilities are recognised as revenue when the Group performs under the contract.
Generally, the Group does not expect to have any contracts where the period between the transfer of the promised goods or services to the customer and payment by the customer exceeds one year. The primary exception considers contracts containing listing services. As the payment for listing admission services appears upfront at the start of the contract, the period between revenue recognition from listing admission services and payment by the customer can exceed one year. However the Group determined that the payment terms were structured not with the primary purpose of obtaining financing from the customer, but to minimise the risk of non-payment as there is not a stated duration of the period of the listing. As a consequence, the Group does not adjust any of the transaction prices for the time value of money.
The Group does not incur material costs to obtain contracts such as sales commissions. Costs to fulfil a contract are costs that relate directly to a contract or a specifically anticipated contract, generate or enhance resources of the Group that will be used to satisfy future performance obligations, and are recoverable. Costs to fulfil a contract are capitalised and amortised on a straight line basis over the term of the specific contract it relates to, consistent with the pattern of recognition of the associated revenue.
Non-underlying items are items of income and expense that are material by their size and/or that are infrequent and unusual by their nature or incidence are not considered to be incurred in the normal course of business and are classified as non-underlying items on the face of the income statement within their relevant category in order to provide further understanding of the ongoing sustainable performance of the Group.
• Operating income and expense items which are material by their size and/or are infrequent and unusual by their nature, such as integration or double run costs of significant projects (one side of the cost to resource both the old and the new services within the project), restructuring costs and costs related to acquisitions that change the perimeter of the Group.
• Non-operating income and expense items which are material by their size and/or are infrequent and unusual by their nature, such as one-off finance costs, gains or losses on sale of subsidiaries and impairments of investments.
• Amortisation and impairment of intangible assets which are recognised as a result of acquisitions. These intangible assets mostly comprise customer relationships, brand names and software that were identified during purchase price allocation (PPA). This amortisation is presented as a non-underlying item in order to provide more meaningful information regarding the Group’s sustainable performance.
The income tax expense for the fiscal year is comprised of current and deferred income tax. Income tax expense is recognised in the Income Statements, except to the extent that it relates to items recognised in other comprehensive income or directly in equity. In this case, the income tax impact is also recognised in other comprehensive income or directly in equity.
The current income tax expense is calculated on the basis of the tax laws enacted or substantively enacted at the balance sheet date in the countries where the Group operates and generates taxable income. The Group recognises liabilities for uncertain tax treatment when it is not probable that the tax authorities will accept the tax treatment. The liabilities are measured through one of the following methods depending on which method is expected to best predict the resolution of the tax uncertainty:
a) The most likely amount - the single most likely amount in a range of possible outcomes. The most likely amount may better predict the resolution of the uncertainty if the possible outcomes are binary or are concentrated on one value.
b) The expected value - the sum of the probability-weighted amounts in a range of possible outcomes. The expected value may better predict the resolution of the uncertainty if there is a range of possible outcomes that are neither binary nor concentrated on one value.
Estimated liabilities for uncertain tax treatments, along with estimates of interest and penalties, are presented within income taxes payable on the Balance Sheet and are included in current income tax expense in the Statement of Profit or Loss.
Deferred income tax is recognised on temporary differences arising between the tax basis of assets and liabilities and their carrying amounts in these Consolidated Financial Statements. However, deferred income tax liabilities are not recognised if they arise from the initial recognition of goodwill. Deferred income tax is not accounted for if it arises from initial recognition of an asset or liability in a transaction, other than a business combination, that at the time of the transaction affects neither accounting nor taxable profit or loss and at the time of the transaction, does not give rise to equal amounts of taxable and deductible temporary differences. If a transaction that is not a business combination gives rise to equal amounts of taxable and deductible differences, deferred taxation on the taxable temporary difference and the deductible temporary differences will be accounted for, which at initial recognition are equal and offset to zero (i.e. leases).
Deferred income tax is determined using tax rates that have been enacted or substantively enacted at the balance sheet date and are expected to apply when the related deferred income tax asset is realised or the deferred income tax liability is settled. Deferred income tax assets are recognised only to the extent that it is probable that future taxable profit will be available against which the temporary differences or tax losses can be utilised. Deferred income tax is provided on temporary differences arising from investments in subsidiaries and associates, except where the timing of the reversal of the temporary difference is controlled by the Group and it is probable that the temporary difference will not reverse in the foreseeable future. Deferred income tax assets and liabilities are offset when there is a legally enforceable right to offset current tax assets against current tax liabilities and when they relate to income taxes levied by the same taxation authority on the same taxable entity.
The Group classifies non-current assets and disposal groups as held for sale if their carrying amounts will be recovered principally through a sale transaction rather than through continuing use. Non-current assets and disposal groups classified as held for sale are measured at the lower of their carrying amount and fair value less costs to sell. Costs to sell are the incremental costs directly attributable to the disposal of an asset (disposal group), excluding finance costs and income tax expense.
The criteria for held for sale classification is regarded as met only when the sale is highly probable and the asset or disposal group is available for immediate sale in its present condition. Actions required to complete the sale should indicate that it is unlikely that significant changes to the sale will be made or that the decision to sell will be withdrawn. Management must be committed to the plan to sell the asset and the sale expected to be completed within one year from the date of the classification.
Property, plant and equipment and intangible assets are not depreciated or amortised once classified as held for sale. Assets and liabilities classified as held for sale are presented separately as current items in the statement of financial position.
In the application of the Group’s accounting policies, management is required to make estimates and assumptions about the carrying amounts of assets and liabilities that are not readily apparent from other sources. The estimates and associated assumptions are based on historical experience and other factors that are considered to be relevant. Actual results may differ from these estimates. The estimates and underlying assumptions are reviewed on an ongoing basis. Revisions to accounting estimates are recognised in the period in which the estimate is revised if the revision affects only that period or in the period of the revision and future periods if the revision affects both current and future periods.
The following critical assumptions concerning the future, and other critical sources of estimation uncertainty at the end of the reporting period, have a significant risk of causing a material adjustment to the carrying amounts of assets and liabilities within the next financial year:
The Group performs goodwill impairment reviews in accordance with the accounting policy described above in Note 18. The recoverable amount of a CGU Group is determined based on a discounted cash flow approach, which requires the use of estimates. The critical assumptions used and the related sensitivity analysis are described in Note 18.
Due to the inherent complexities arising from the nature of the Group’s business, and from conducting business and being taxed in a substantial number of jurisdictions, critical assumptions and estimates are required to be made for income taxes. The Group computes income tax expense for each of the jurisdictions in which it operates. However, actual amounts of income tax due only become final upon filing and acceptance of the tax return by relevant authorities, which may not occur for several years subsequent to issuance of these Consolidated Financial Statements.
The estimation of income taxes also includes evaluating the recoverability of deferred income tax assets based on an assessment of the ability to use the underlying future tax deductions against future taxable income before they expire. This assessment is based upon existing tax laws and estimates of future taxable income. To the extent estimates differ from the final tax return, earnings may be affected in a subsequent period.
The Group operates in various countries with local tax regulations. New tax legislation being issued in certain territories as well as transactions that the Group enters into regularly result in potential tax exposures. The calculation of our tax liabilities involves uncertainties in the application of complex tax laws. Our estimate for the potential outcome of any uncertain tax treatment is highly judgmental. However, the Group believes that it has adequately provided for uncertain tax treatments. Settlement of these uncertainties in a manner inconsistent with our expectations could have a material impact on our results of operations, financial condition and cash flows. The Group recognises a liability for uncertain tax treatments when it is not probable that a taxation authority will accept an uncertain tax treatment.
The Group holds investments in unlisted equity securities which are carried at fair value in the balance sheet. The valuation methodology and critical assumptions are described in Note 20 and 35.
The Group had classified the interest in LCH SA as an investment in associate suggesting significant influence even though it owned less than 20% of the voting rights (see Note 7). The Group concluded that it had significant influence over this investment, which was derived from the governance structure that was put in place, the Group’s position as the largest customer and sole minority shareholder of LCH SA.
The Group may structure its business combinations in a way that leads to recognition of contingent consideration to selling shareholders and/or buy options for equity held by non-controlling interests. Contingent consideration and buy options are recognised at fair value on acquisition date. When the contingent consideration or buy option meets the definition of a financial liability or financial instrument, it is subsequently re-measured to fair value at each reporting date. The determination of fair value is based on the expected level of EBITDA3 over the last 12 months that precede the contractual date (in case of contingent consideration) or exercise date of the underlying call- and put options (in case of buy option). The Group monitors the expected EBITDA3 based on updated forecast information from the acquired companies involved.
The cost of other intangible assets that are acquired in the course of business combinations, corresponds to their acquisition date fair values. Depending on the nature of the intangible asset, fair value is determined by application of:
Assets with a finite useful life are amortised using the straight-line method over their expected useful life. Assets with an indefinite useful life are tested for impairment at least once a year.
The Group applied the following judgments that significantly affect the determination of the amount and timing of revenue from contracts with customers:
Identifying performance obligations and determining the timing of revenue recognition of Listing admission fees
The Group provides services related to the initial (and subsequent) listing of securities on its markets and hereto directly related corporate action services, and ongoing services related to the continuous listing.
The Group determined that the admission services around initial (and subsequent) admission and its directly related corporate action services do not transfer a good or service to the customer, but are considered activities that the Group needs to undertake to enable the customer to be listed. The Group concluded that these activities should be combined with the ongoing listing services and should be used as inputs to produce the combined output, which is the service of being listed. As the service of being listed is satisfied over a period of time, as the customer simultaneously receives and consumes the benefits from the service, the related revenues are therefore recognised over a period of time.
The Group determined that the period of time that best reflects the satisfaction of listing admission services is the period over which the customer actually benefits from the admission. An average lifetime of companies being listed on Euronext markets would serve as best proxy for the period that a listing customer benefits from an admission. Specific local market characteristics can result and would justify differences in amortisation terms. Based on historic evidence, the Group has defined the following average lifetimes for the relevant groupings of listed securities:
The Group has considered the type of cost that is directly associated to a listing contract and that can be separately identifiable. Such cost would typically concern staff cost incurred by the Listings team involved in admission- and subsequent listing of an issuer. There is no correlation between number of listings and staff cost associated to the Listings team.
The majority of the cost to obtain and fulfil the contract is incurred in the period before the actual admission. The remaining cost associated to an admission and subsequent listing that is recorded post-admission, and its impact on the Group’s income statement, would be marginal, therefore the Group has decided not to capitalise cost incurred to obtain- or fulfil listing contracts.
The Group entered into a clearing agreement with LCH SA in respect of the clearing of trades on Euronext continental Europe derivatives markets (the “Derivatives Clearing Agreement”). Under the terms of this Derivatives Clearing Agreement Euronext agreed with LCH SA to share revenues and receives clearing fee revenues based on the number of trades on these markets cleared through LCH SA. In exchange for that, Euronext has agreed to pay LCH SA a fixed fee plus a variable fee based on revenues.
The definition of the accounting treatment of this agreement required significant management judgment for the valuation and weighting of the indicators leading the principal versus agent accounting analysis. Based on all facts and circumstances around this arrangement, management has concluded that Euronext is ‘principal’ in providing Derivatives clearing services to its trading members. Therefore Euronext recognises (i) the clearing fees received as post trade revenues, and (ii) the fixed and variable fees paid to LCH SA as other operational expenses.
The Group uses a provision matrix to calculate ECLs for trade and contract receivables. To measure expected credit losses, trade and contract receivables have been grouped based on shared credit risk characteristics and the days past due. The historical loss rates are based on the payment profiles of the sales over a period of 24 months before reporting date and the corresponding historical credit loss experience within this period. The historical loss rates are adjusted to reflect current and forward-looking factors specific to the debtors and economic environment.
The provision matrix is initially based on the Group’s historical observed default rates. The Group will calibrate the matrix to adjust the historical credit loss experience with forward-looking information. At every reporting date, the historical observed default rates are updated and changes in the forward-looking estimates are analysed.
The assessment of the correlation between historical observed default rates, forecast economic conditions and ECLs is a significant estimate. The amount of ECLs is sensitive to changes in circumstances and of forecast economic conditions. The Group’s historical credit loss experience and forecast of economic conditions may also not be representative of customer’s actual default in the future. The information about the ECLs on the Group’s trade and contract receivables is disclosed in Note 37.5.1
In determining the lease term, management assesses the period for which the contract is enforceable. It considers all facts and circumstances that create an economic incentive to exercise an extension option, or not exercise a termination option. Extension options (or periods after termination options) are only included in the lease term if the lease is reasonably certain to be extended (or not terminated). If the Group concludes that the contract is enforceable beyond the notice period of a cancellable lease (or the initial period of a renewable lease), it then need to assess whether the Group is reasonably certain not to exercise the option to terminate the lease. However in general, the Group’s lease portfolio contains very limited leases that include renewal -or termination options.
The Group cannot readily determine the interest rate implicit in the lease, therefore, it uses its incremental borrowing rate (IBR) to measure lease liabilities. The IBR is the rate of interest that the Group would have to pay to borrow over a similar term, and with a similar security, the funds necessary to obtain an asset of a similar value to the right-of-use asset in a similar economic environment. The IBR therefore reflects what the Group ‘would have to pay’, which requires estimation when no observable rates are available or when they need to be adjusted to reflect the terms and conditions of the lease. The Group estimates the IBR using the observable inputs (such as market interest rates) when available and makes certain entity-specific estimates if needed.
The Group develops various software applications for internal use. Development costs for self-developed intangible assets are capitalized if the applicable criteria of IAS 38 are fulfilled. Development costs that do not satisfy the requirements for capitalization are expensed as incurred. Capitalised own software development costs are amortized over the useful economic life of the asset and charged on a straight line basis to the income statement. The useful lives are management’s best estimate of the period over which value from the asset is realized. In determining the useful lives, management considers a number of factors including: expected usage by the entity of the asset, product upgrade cycles for software and technology assets and the level of maintenance required to maintain the asset’s operating capability.
The International Accounting Standards Board (IASB) continues to issue new standards and interpretations, and amendments to existing standards. The Group applies these new standards when effective and endorsed by the European Union. The Group has not opted for early adoption for any of these standards.
The Group has applied the following standards and amendments for the first time for their annual reporting period commencing 1 January 2023.
In May 2017, the IASB issued IFRS17 Insurance Contracts (IFRS 17), a comprehensive new accounting standard for insurance contracts covering recognition and measurement, presentation and disclosure. This standard does not affect the Group.
In February 2021, the IASB issued amendments to IAS 8, in which it introduces a definition of ‘accounting estimates’. The amendments clarify the distinction between changes in accounting estimates and changes in accounting policies and the correction of errors. Also, they clarify how entities use measurement techniques and inputs to develop accounting estimates. The amendments had no impact on the Group.
In February 2021, the IASB issued amendments to IAS 1 and IFRS Practice Statement 2 Making Materiality Judgements, in which it provides guidance and examples to help entities apply materiality judgements to accounting policy disclosures. The amendments aim to help entities provide accounting policy disclosures that are more useful by replacing the requirement for entities to disclose their ‘significant’ accounting policies with a requirement to disclose their ‘material’ accounting policies and adding guidance on how entities apply the concept of materiality in making decisions about accounting policy disclosures.
The amendments had no material impact on the Group’s disclosures of accounting policies. The amendments had no impact on the measurement, recognition or presentation of any items in the Group’s financial statements.
Amendment to IAS 12 - Deferred Tax related to Assets and Liabilities arising from a Single Transaction
The amendments clarify that the initial recognition exemption does not apply to transactions in which equal amounts of deductible and taxable temporary differences arise on initial recognition. The amendments had no impact on the Group.
The amendments to IAS 12 have been introduced in response to the OECD’s BEPS Pillar Two rules and include:
• A mandatory temporary exception to the recognition and disclosure of deferred taxes arising from the jurisdictional implementation of the Pillar Two model rules; and
• Disclosure requirements for affected entities to help users of the financial statements better understand an entity’s exposure to Pillar Two income taxes arising from that legislation, particularly before its effective date.
The mandatory temporary exception - the use of which is required to be disclosed - applies immediately. The remaining disclosure requirements apply for annual reporting periods beginning on or after 1 January 2023, but not for any interim periods ending on or before 31 December 2023.
The new and amended standards and interpretations that are issued, but not yet effective, up to the date of issuance of the Group’s financial statements are disclosed below. The Group intends to adopt these new and amended standards and interpretations, if applicable, when they become effective.
In January 2020, the IASB issued amendments to paragraphs 69 to 76 of IAS 1 to specify the requirements for classifying liabilities as current or non-current. The amendments clarify:
• That classification is unaffected by the likelihood that an entity will exercise its deferral right
• That only if an embedded derivative in a convertible liability is itself an equity instrument would the terms of a liability not impact its classification
The amendments are effective for annual reporting periods beginning on or after 1 January 2024 and must be applied retrospectively. The Group is currently assessing the impact the amendments will have on current practice.
In October 2022, the IASB issued Non-current Liabilities with Covenants, which amended IAS 1 Presentation of Financial Statements. The amendments:
• Modify the requirements introduced by ‘Classification of Liabilities as Current or Non-current’ on how an entity classifies debt and other financial liabilities as current or non-current in particular circumstances: Only covenants with which an entity is required to comply on or before the reporting date affect the classification of a liability as current or non-current. In addition, an entity has to disclose information in the notes that enables users of financial statements to understand the risk that non-current liabilities with covenants could become repayable within twelve months.
The amendments are effective for reporting periods beginning on or after 1 January 2024. The amendments are applied retrospectively and earlier application is permitted. The Group is currently assessing the impact that the amendments will have on current practice.
In October 2022, the IASB issued Non-current Liabilities with Covenants, which amended IAS In September 2022, the IASB issued amendments to IFRS 16 to specify the requirements that a seller-lessee uses in measuring the lease liability arising in a sale and leaseback transaction, to ensure the seller-lessee does not recognise any amount of the gain or loss that relates to the right of use it retains.
The amendments are effective for annual reporting periods beginning on or after 1 January 2024 and must applied retrospectively to sale and leaseback transactions entered into after the date of initial application of IFRS 16. Earlier application is permitted and that fact must be disclosed. The amendments are not expected to have a material impact on the Group.
In May 2023, the IASB issued amendments to IAS 7 Statement of Cash Flows and IFRS 7 Financial Instruments: Disclosures to clarify the characteristics of supplier finance arrangements and require additional disclosure of such arrangements. The disclosure requirements in the amendments are intended to assist users of financial statements in understanding the effects of supplier finance arrangements on an entity’s liabilities, cash flows and exposure to liquidity risk. The amendments will be effective for annual reporting periods beginning on or after 1 January 2024. Early adoption is permitted, but will need to be disclosed. The amendments are not expected to have a material impact on the Group.
There are no other IFRS’s or IFRIC interpretations not yet effective, that would be expected to have a material impact on the Group in the current or future reporting periods and on foreseeable future transactions.
The following table provides an overview of the Group’s subsidiaries, associates, joint-ventures and non-current investments:
Ownership Subsidiaries Domicile As at 31
December
2023As at 31
December
2022Euronext Amsterdam N.V. The Netherlands 100.00% 100.00% Euronext Brussels S.A./N.V. Belgium 100.00% 100.00% Euronext IP & IT Holding B.V. The Netherlands 100.00% 100.00% Euronext Hong Kong Limited (g) Hong Kong 0.00% 100.00% Euronext Lisbon S.A. (a) Portugal 100.00% 100.00% Euronext London Ltd. United Kingdom 100.00% 100.00% Euronext Paris S.A. France 100.00% 100.00% Euronext Technologies S.A.S. France 100.00% 100.00% Euronext Technologies Unipessoal Lda. Portugal 100.00% 100.00% Euronext Technologies S.r.l. Italy 100.00% 100.00% Interbolsa S.A. (b),(c) Portugal 100.00% 100.00% The Irish Stock Exchange Plc. (d) Ireland 100.00% 100.00% Euronext Corporate Services B.V. The Netherlands 100.00% 100.00% Company Webcast B.V. The Netherlands 100.00% 100.00% iBabs B.V. The Netherlands 100.00% 100.00% Euronext Corporate Services UK Ltd. United Kingdom 100.00% 100.00% Euronext Corporate Services Sweden AB Sweden 100.00% 100.00% Euronext US Inc. United States 100.00% 100.00% Euronext Market Services LLC United States 100.00% 100.00% Euronext Markets Americas LLC United States 100.00% 100.00% Euronext FX Inc. United States 100.00% 100.00% Euronext Markets Singapore Pte Ltd. Singapore 100.00% 100.00% Euronext UK Holdings Ltd. United Kingdom 100.00% 100.00% Commcise Software Ltd. United Kingdom 100.00% 100.00% Euronext India Private Limited India 100.00% 100.00% Oslo Børs ASA Norway 100.00% 100.00% Verdipapirsentralen ASA (“VPS”) (c) Norway 100.00% 100.00% Fish Pool ASA Norway 97.00% 97.00% NOTC AS (e) Norway 0.00% 100.00% Euronext Nordics Holding AS Norway 100.00% 100.00% Nord Pool Holding AS Norway 66.00% 66.00% Nord Pool AS Norway 66.00% 66.00% Nord Pool Finland Oy Finland 66.00% 66.00% Nord Pool AB Sweden 66.00% 66.00% Nord Pool European Market Coupling Operator AS Norway 66.00% 66.00% Euronext Corporate Services Finland Oy Finland 100.00% 100.00% Euronext Corporate Services France S.A.S. France 100.00% 100.00% VP Securities AS (c) Denmark 100.00% 100.00% Euronext Italy Merger S.r.l. (m) Italy 0.00% 100.00% Euronext Italy Merger 2 S.r.l. (m) Italy 100.00% 0.00% Euronext Holding Italia S.p.A. Italy 100.00% 100.00% GATElab S.r.l. Italy 100.00% 100.00% GATElab Ltd. United Kingdom 100.00% 100.00% Bit Market Services S.p.A. (g) Italy 99.99% 99.99% Borsa Italiana S.p.A. Italy 99.99% 99.99% Cassa di Compensazione e Garanzia S.p.A. (f) Italy 99.99% 99.99% Monte Titoli S.p.A. (c) Italy 98.92% 98.92% MTS S.p.A. (h) Italy 63.14% 62.52% Marche de Titres France SAS (h) France 63.14% 62.52% Euro MTS Ltd. (h) United Kingdom 63.14% 62.52% Elite S.p.A. Italy 74.99% 74.99% Elite Club Deal Ltd. (g) United Kingdom 0.00% 74.99% Elite SIM S.p.A. Italy 74.99% 74.99% Euronext Corporate Services GmbH Germany 100.00% 100.00% Euronext Corporate Services S.r.l. Italy 100.00% 100.00% Stichting Euronext Foundation (i) The Netherlands 0.00% 0.00% Associates
Domicile LCH SA (j) France 0.00% 11.10% Tokeny S.a.r.l. (k) Luxembourg 0.00% 18.93% ATS Advanced Technology Solutions S.p.A. Italy 30.00% 30.00% MTS Associated Markets SA Belgium 23.00% 23.00% Joint Ventures
Domicile LiquidShare S.A. (g) France 16.23% 16.23% FinansNett Norge Norway 50.00% 50.00% Non-current investments
Domicile Sicovam Holding S.A. France 9.60% 9.60% Euroclear S.A./N.V. Belgium 3.53% 3.53% EuroCTP B.V. (l) The Netherlands 18.95% 0.00% Nordic Credit Rating AS Norway 5.00% 5.00% Association of National Numbering Agencies Belgium 2.20% 2.20% Investor Compensation Company Designated Activity Company Ireland 33.30% 33.30% (a) Legal name of Euronext Lisbon S.A. is Euronext Lisbon - Sociedade Gestora de Mercados Regulamentados, S.A. (b) Legal name of Interbolsa S.A. is Interbolsa - Sociedade Gestora de Sistemas de Liquidaçao e de Sistemas Centralizados de Valores Mobiliários, S.A. (c) Interbolsa S.A., Verdipapirsentralen ASA, VP Securities AS and Monte Titoli S.p.A. respectively operate under the business names “Euronext Securities Porto”, “Euronext Securities Oslo”, “Euronext Securities Copenhagen” and “Euronext Securities Milan”. (d) The Irish Stock Exchange plc. operates under the business name Euronext Dublin. (e) In 2023, NOTC AS has merged into Oslo Børs ASA. (f) Cassa di Compensazione e Garanzia S.p.A. operates under the business name “Euronext Clearing”. (g) Euronext Hong Kong limited and Elite Club Deal Ltd. were liquidated in 2023 and Bit Market Services S.p.A. and LiquidShare S.A. were under liquidation as at 31 December 2023. LiquidShare S.A. was ultimately liquidated in January 2024. (h) On 21 November 2023, the Group acquired an additional interest of 0.62% in MTS S.p.A. (and its subsidiaries). (i) Stichting Euronext Foundation is not owned by the Group but included in the scope of consolidation. (j) On 6 July 2023, the Group sold its 11.1% interest in associate LCH SA to LCH Group Ltd for consideration of €111.0 million. (k) On 1 December 2023, the Group sold its 18.93% interest in associate Tokeny S.a.r.l. for an amount of €11.4 million. (l) ln 2023, the Group acquired an 18.95% equity interest in EuroCTP B.V. (incorporated on 23 August 2023). (m) In 2023, Euronext Italy Merger S.r.l. was liquidated and Euronext Italy Merger S.r.l. 2 was incorporated. No new business combinations occurred during the year ended 31 December 2023. The only impact from business combinations during the year related to the finalisation of the purchase price allocation of the acquired technology businesses of Nexi S.p.A., which impact is further described below.
On 1 December 2022, the Group acquired the technology businesses of Nexi S.p.A., an Italian bank specialised in payment systems, currently powering MTS and Euronext Securities Milan. The purchase price for this business acquisition approximated €57 million (on a debt free, cash free basis).
In 2023, the Group finalised the purchase price allocation of the acquired technology businesses of Nexi S.p.A.
The initial book values of the net assets acquired were considered not material from a Euronext Group perspective.
The Group identified €10.1 million of software intangible assets and €3.2 million of customer relationships as part of the purchase price allocation, which were subsequently offset in goodwill (see Note 18).
On 21 November 2023, the Group acquired an additional interest of 0.62% of the shares in MTS S.p.A., increasing the Group’s ownership in MTS S.p.A. to 63.14% (2022: 62.52%).
Cash consideration of €2.5 million was paid to the non-controlling shareholders, which was recognised directly against shareholders’ equity.
The Group recognised a decrease in non-controlling interest of €1.6 million, reflecting the carrying amount of non-controlling interest acquired.
Financial information of subsidiaries that have material non-controlling interest is provided below.
The summarised financial information of these subsidiaries is provided below. This information is based on amounts before inter-company eliminations.
Summarised balance sheet Nord Pool Holding AS MTS S.p.A (In thousands of euros) 31 Dec
202331 Dec
202231 Dec
202331 Dec
2022Current assets 172,104 159,574 80,353 51,113 Current liabilities 136,028 131,173 23,477 33,192 Current net assets 36,076 28,401 56,876 17,921 Non-current assets 20,698 26,084 354,368 358,026 Non-current liabilities 3,508 5,137 73,585 74,355 Non-current net assets 17,190 20,947 280,783 283,671 Net assets 53,266 49,348 337,659 301,592 Accumulated NCI 18,110 16,778 124,480 113,022 Summarised statement of comprehensive income Nord Pool Holding AS MTS S.p.A (In thousands of euros) 2023 2022 2023 2022 Revenue 47,890 42,156 91,485 79,073 Profit for the year 15,164 7,141 41,797 26,505 OCI 21 (180) 44 65 Total comprehensive income 15,185 6,961 41,841 26,570 Profit / (loss) allocated to NCI 5,156 2,428 15,410 9,934 Dividends paid to NCI 2,821 2,251 2,226 8,345 Summarised cash flow information Nord Pool Holding AS MTS S.p.A (In thousands of euros) 2023 2022 2023 2022 Cash flow from operating activities 31,186 (18,723) 63,088 665 Cash flow from investing activities (1,017) (1,393) (34,286) 38,423 Cash flow from financing activities (8,934) (7,343) (10,105) (4,484) Non-cash exchange gains/ (losses) (8,281) (15,811) – – Net increase / (decrease) in cash and cash equivalents 12,954 (43,270) 18,697 34,604 Set out below are the associates and joint ventures of the Group as at 31 December 2023. The country of incorporation or registration is also their principal place of business, and the proportion of ownership interest is the same as the proportion of voting rights held.
% of ownership
interestCarrying amount
(In thousands of
eurosName of entity Place of business / country of Incorporation 2023 2022 Nature of relationship 2023 2022 % % LCH SA France –% 11.1% Associate (a) – 70,563 Immaterial joint ventures 230 348 Immaterial associates 1,099 1,098 Total equity accounted investments 1,329 72,009 (a) LCH SA is a Continental European clearing house, offering clearing services for a diverse range of asset classes. As described in Note 3, the Group determined that it had significant influence over LCH SA even though it only held 11.1% of the voting rights. On 6 July 2023, the Group sold its 11.1% interest in LCH SA to LCH Group Ltd for consideration of €111.0 million (see Note 14). The Group has no outstanding contingent liabilities with respect to its associates or joint ventures.
The tables below provide summarised financial information for those associates and joint ventures that are material to the Group. The information disclosed reflects the amounts presented in the financial statements of the relevant associates or joint ventures and not Euronext’s share of those amounts. They have been amended to reflect adjustments made by the entity when using the equity method, including fair value adjustments and modifications for differences in accounting policy.
On 6 July 2023, the Group sold its 11.1% interest in LCH SA to LCH Group Ltd. Therefore, only the comparative financial information is disclosed.
Summarised balance sheet LCH SA (In thousands of euros) 31 Dec
202331 Dec
2022Non-current assets – 141,920 Current assets – 579,389,798 Non-current liabilities – (6,900) Current liabilities – (579,051,100) Net assets – 473,718 Reconciliation to carrying amounts: Opening net assets 1 January – 439,900 Adjustments – (4,782) Profit/(loss) for the year (a) – 101,700 Other comprehensive income – (3,184) Dividends paid – (59,916) Closing net assets – 473,718 Group’s share in % –% 11.1 % Group’s share in thousands of euros – 52,583 Goodwill – 17,980 Carrying amount – 70,563 (a) In 2023, LCH SA contributed a €6.6 million profit (2022: €10.4 million) to the line ’Share of net profit/(loss) of associates and joint ventures accounted for using the equity method, and impairments thereof’ in the Consolidated Statement of Profit or Loss. Summarised statement of comprehensive income LCH SA (In thousands of euros) 2023 2022 Revenue – 204,100 Profit from continuing operations – 101,700 Profit from discontinued operations – – Profit for the year – 101,700 Other comprehensive income – (3,184) Total comprehensive income – 98,516 Dividends received from associates – 6,748 In addition to the interest in material associates and joint ventures disclosed above, the Group also has interests in individually immaterial associates and individually immaterial joint ventures, that are all accounted for using the equity method.
The Group had an 18.93% interest in Tokeny S.a.r.l., a tokenisation platform that provides users end-to-end solutions to issue, manage and transfer tokenised securities on public blockchain. On 1 December 2023, the Group sold its interest in Tokeny S.a.r.l. (see Note 2).
The Group has an 23.0% interest in MTS Associated Markets S.A., offering an electronic trading platform for sovereign securities (e.g. government bonds).
In addition, the Group has an 30% interest in ATS Advanced Technology Solutions S.p.A., which line of business includes designing, developing, and producing prepackaged computer software.
(In thousands of euros) 2023 2022 Aggregate carrying amount of individually immaterial associates 1,099 1,098 Aggregate amounts of the group’s share of: Profit/(loss) from continuing operations 13 49 Post-tax profit or loss from discontinued operations – – Other comprehensive income – – Total comprehensive income 13 49 The Group has an interest of 50% in joint venture FinansNett Norge AS, a company offering data communications through a metropolitan area network (MAN) in Oslo. This network provides communication services for use by backup and disaster recovery solutions as used by brokers and other participants in the financial sector.
In addition, the Group (sharing joint control with the other founders) has an interest of 16.23% in LiquidShare SAS, a fintech joint venture with the objective to improve SME’s access to capital markets and improving the transparency and security of post-trading operations using blockchain technology. In 2022, following indications of a deteriorated future cash flow situation and Board decision to propose to the Shareholders meeting to liquidate the entity, the investment in joint venture LiquidShare was impaired by €1.5 million to zero value. The company was liquidated in January 2024.
(In thousands of euros) 2023 2022 Aggregate carrying amount of individually immaterial joint ventures 230 348 Aggregate amounts of the group’s share of: Profit/(loss) from continuing operations (92) (142) Post-tax profit or loss from discontinued operations – – Other comprehensive income – – Total comprehensive income (92 ) (142 ) Substantially all of the Group’s revenues are considered to be revenues from contracts with customers. At 31 December 2023 and 2022, there were no customers that individually exceeded 10% of the Group’s revenue.
In thousands of euros Year ended
31 DecemberTiming of revenue recognition Year ended
31 DecemberTiming of revenue recognition Product or service transferred Product or service transferred Major revenue stream 2023 at a point in
timeover time 2022 at a point in
timeover time Listing 220,642 15,763 204,879 218,380 14,989 203,391 of which Primary listing services and other 175,189 4,421 170,768 178,868 4,280 174,588 Corporate services 45,454 11,342 34,112 39,512 10,709 28,803 Trading revenue 490,008 472,910 17,097 514,125 491,609 22,516 of which Cash trading 265,439 264,039 1,400 301,714 295,330 6,384 Derivatives trading 54,168 52,720 1,448 58,380 56,743 1,637 Fixed income trading 107,425 93,176 14,249 92,951 78,456 14,495 FX trading 25,556 25,556 – 28,406 28,406 – Power trading 37,420 37,420 – 32,674 32,674 – Investor services 11,375 – 11,375 9,596 – 9,596 Advanced data services 224,774 1,306 223,469 212,053 1,523 210,530 Post-trade 370,183 205,697 164,486 364,519 206,701 157,818 of which Clearing 121,283 121,283 – 121,393 121,393 – Custody & Settlement and other 248,900 84,414 164,486 243,126 85,308 157,818 Euronext Technology solutions & other revenue 109,894 624 109,270 100,101 1,020 99,081 Total revenue from contracts with customers 1,426,876 696,300 730,576 1,418,774 715,842 702,932 The significant movements in revenues from contracts with customers during the year, related to the following:
■ Cash -and derivatives trading revenue decreased by €32.5 million, which is due to a drop in trading volumes when compared to prior period that included a highly volatile first quarter, driven by the Russian invasion of Ukraine. ■ Fixed income trading revenue increased by €14.5 million, which is almost fully attributable to the MTS S.p.A. bond trading platform and driven by increasing interest rates and supportive market volatility in 2023. ■ Advanced data services revenues increased by €12.7 million, which is driven by a strong performance of the core data business. ■ Technology solutions and other revenue increased by €9.8 million, which is driven by the internalisation of the colocation activity following the migration of Euronext’s Core Data Centre to Bergamo. In thousands of euros France Italy Nether
landsUnited
KingdomBelgium Portugal Ireland United
StatesNorway Sweden Denmark Finland Germany Total 2023 Revenue from contracts with customers (a) 366,155 474,402 175,667 9,603 29,821 36,151 37,592 28,614 187,576 4,790 75,966 484 55 1,426,876 2022 Revenue from contracts with customers (a) 375,945 436,696 184,858 8,029 31,039 34,604 39,104 31,266 199,507 4,137 73,069 520 – 1,418,774 (a) Cash trading, Derivatives trading, Clearing and Advanced data services revenues are attributed to the country where the exchange is domiciled. Revenues from other categories are attributed to the billing entity. Trade receivables are non-interest bearing and are generally due on terms of 30 to 90 days and represent amounts in respect of billed revenue, for which the Group has an unconditional right to consideration (i.e. only the passage of time is required before payment of the consideration is due).
Trade receivables decreased by €8.9 million, which is mainly attributable to less invoicing of volume related revenues driven by a drop in volatility when compared to prior period.
Contract receivables represent amounts in respect of unbilled revenue, for which the Group has an unconditional right to consideration (i.e. only the passage of time is required before payment of the consideration is due). Contract receivables decreased by €2.8 million, which is mainly attributable to less accrued income at Borsa Italiana Group.
In 2023, €8.6 million (2022: €7.4 million) was recognised as provision for expected credit losses on trade and contract receivables. The increase in loss allowance provision, was primarily due to increased risk on specific debtors.
Contract liabilities primarily relate to received consideration (or an amount of consideration is due) from customers for the initial (or subsequent) listing of equity securities, bond lifetime fees, indices licenses, software maintenance & hosting and corporate services. In 2023, contract liabilities remained relatively stable with a slight increase of €0.3 million.
Revenue recognised in the reporting period that was included in the contract liability balance at the beginning of the period amounted to €70.2 million (2022: €74.8 million). The amount of revenue recognised in the reporting period from performance obligations satisfied (or partially satisfied) in previous periods was considered not material (2022: not material).
Information about the Group’s performance obligations are described in Note 3 ‘Accounting policies and judgements’.
The transaction price allocated to the remaining performance obligations (unsatisfied or partially unsatisfied) are as follows:
The remaining performance obligations expected to be recognised in more than one year primarily relate to the initial (or subsequent) listing of equity securities and bond lifetime fees which are recognised over the related listing period. Other performance obligations included in this category are software maintenance & hosting contracts, market data and Indices license contracts and corporate services license contracts. The increase in remaining performance obligations to be satisfied within one year is primarily linked to an increased contract portfolio at corporate services business. The decrease in remaining performance obligations to be satisfied in more than one year is related to a declining listing admission fees balance, as a result of less IPOs in 2023. Furthermore, the shrinking term of certain long-term technology solutions contacts over time also contributes to the decrease.
Income recognised in the CCP clearing business executed by Euronext Clearing includes net treasury income earned on margin and default funds, held as part of the risk management process.
For the year ended 31 December 2023, ‘underlying’ net treasury income through CCP business amounted to €46.7 million (2022: €44.0 million) and is the result of gross interest income of €785.4 million (2022: €60.9 million), less gross interest expense of €738.7 million (2022: €16.8 million) (see Note 35). In a context of positive interest rates, the Group realized total interest earnings from Central Bank and LCH deposits of €778.5 million and a net treasury income from financial assets of €2.1 million. The Group recognised total interests paid on clearing members’ margin and default fund as treasury expense, which amounted to €733.9 million.
In July 2022, the Group partially disposed of the debt investment portfolio held at Euronext Clearing. The related revaluation loss of €48.9 million was recycled from Other Comprehensive Income to ‘non-underlying’ net treasury income (see Note 12).
Other income of €1.2 million (2022: €4.9 million) primarily consists of transitional income from services provided by Borsa Italiana Group to London Stock Exchange Group (LSEG) to facilitate the transition of ownership following the acquisition of Borsa Italiana Group.
Transitional Service Agreements (“TSAs”) were established, providing for temporary services rendered to or received from LSEG. Each individual service is priced separately, generally on a fixed fee basis, based on actual usage or mutually agreed service level. The agreement was established on arm’s length basis.
Services rendered to LSEG primarily include technology and various ancillary services. All such services to LSEG are transitional and, accordingly, the related income from LSEG phased out during 2023.
Expenses for services received from LSEG under this agreement are recognised in other operational expenses (see Note 11). These services will be phased out after the migration of Borsa Italiana Group to Euronext trading platform Optiq® is completed in 2024.
Year ended
31 December 2023Year ended
31 December 2022In thousands of euros Underlying
itemsNon-
Underlying
itemsTotal Underlying
itemsNon-
Underlying
itemsTotal Salaries and other short term benefits (222,538) (11,548) (234,086) (212,764) (5,986) (218,750) Social security contributions (67,385) (1,192) (68,577) (60,070) (110) (60,180) Share-based payment costs (14,378) – (14,378) (13,994) – (13,994) Pension cost - defined benefit plans (8,385) (190) (8,575) (7,590) (22) (7,612) Pension cost - defined contribution plans (6,799) (1) (6,800) (6,641) 160 (6,481) Total salaries and employee benefits (319,485 ) (12,931 ) (332,416 ) (301,059 ) (5,958 ) (307,017 ) Underlying salaries and employee benefits increased, primarily due to the increase in FTE when compared to prior period.
Non-underlying salaries and employee benefits mainly related to termination expenses linked to the integration of the Borsa Italiana Group activities with those of the Group and termination expenses in the various other Euronext entities (see Note 12).
At the end of the year, the number of employees, based on full-time equivalents (FTE) stood at 2,297(2022: 2,203).
In 2023, ’Share based payments costs’ primarily contain costs related to the LTI Plans 2020, 2021, 2022 and 2023. Details of these plans are disclosed in Note 28.
Year ended
31 December 2023Year ended
31 December 2022In thousands of euros Underlying
itemsNon-
Underlying
itemsTotal Underlying
itemsNon-
Underlying
itemsTotal Depreciation of tangible fixed assets (18,925) (3,242) (22,167) (16,528) (2,291) (18,819) Amortisation of intangible fixed assets (33,874) (89,125) (122,999) (29,801) (85,555) (115,356) Depreciation of right-of-use assets (21,416) (3,549) (24,965) (22,500) (3,516) (26,016) Total depreciation and amortisation (74,215) (95,916) (170,131) (68,829) (91,362) (160,191) Underlying depreciation and amortisation increased, primarily due to the (phased) go-live of several internally developed software assets.
Non-underlying depreciation and amortisation mainly related to amortisation of acquired intangible assets (PPA) and accelerated depreciation of the right-of-use asset of the datacentre in Basildon (see Note 12).
Year ended
31 December 2023Year ended
31 December 2022In thousands of euros Underlying
itemsNon-
Underlying
itemsTotal Underlying
itemsNon-
Underlying
itemsTotal Systems and communications (94,856) (7,766) (102,622) (116,676) (5,248) (121,924) Professional services (58,260) (18,209) (76,469) (58,740) (12,493) (71,233) Clearing expenses (a) (34,502) – (34,502) (35,604) – (35,604) Accommodation (17,913) (799) (18,712) (13,533) 12 (13,521) Other expenses (b) (85,025) (38,593) (123,618) (80,532) (3,530) (84,062) Total other operational expenses (290,556) (65,367) (355,923) (305,085) (21,259) (326,344) Underlying other operational expenses decreased, primarily due to a significant drop in expenses for services received from LSEG under the TSA agreements, which include the use of operational systems and infrastructure, as well as certain market data, hosting, connectivity and other services.
These services will be phased out after the migration of Borsa Italiana Group to Euronext trading platform Optiq® is completed in 2024. For the year ended 31 December 2023, approximately €2.7 million of transitional costs were recognised (2022: approximately €10.4 million).
Non-underlying other operational expenses included the termination fees and migration fees of €36.6 million related to the termination of the Derivatives Clearing Agreement with LCH SA. Furthermore, it comprises cost incurred to integrate the Borsa Italiana Group activities with those of the Group and costs related to acquisitions that change the perimeter of the Group (see Note 12).
Year ended In thousands of euros 31 December
202331 December
2022Non-underlying revenues and income Realisation of fair value changes upon disposal of debt investments a) – (48,951) – (48,951) Non-underlying salaries and employee benefits Integration -and double run costs b) (8,836) (6,472) Restructuring costs (4,095) 514 (12,931) (5,958) Non-underlying depreciation and amortisation Integration -and double run costs b) (11,152) (6,912) Amortisation and impairment of acquired intangible assets (PPA) c) (81,913) (83,664) Amortisation and impairment of other assets (2,851) (786) (95,916) (91,362) Non-underlying other operational expenses Integration -and double run costs b) (61,107) (16,736) Acquisition costs d) (4,710) (3,426) Litigation (provisions)/settlements 450 (549) Other – (548) (65,367) (21,259) Non-underlying non-operating items e) Finance costs (31) – (Loss)/gain on sale of subsidiaries (206) 2,274 Gain on sale of associate 53,028 – Impairment of associates and joint ventures – (1,526) 52,791 748 Non-underlying items before tax (121,423) (166,782) Tax on non-underlying items f) 46,228 44,716 Non-controlling interest 4,088 4,585 Non-underlying profit / (loss) for the period attributable to the shareholders of the Company (71,107) (117,481) a) Following a one-off partial disposal of the debt investment portfolio held at Euronext Clearing, the Group recycled the related revaluation loss of €48.9 million from Other Comprehensive Income to net treasury income, during the comparative period. b) The total integration- and double run costs amounted to €81.1 million (2022: €30.1 million), which included the termination fees and migration fees of €36.6 million related to the termination of the Derivatives Clearing Agreement with LCH SA (see Note 2). The remainder of the cost were attributable to significant projects and activities to integrate the Borsa Italiana Group businesses with those of the Group. c) Amortisation of intangible assets that were recorded as a result of acquisitions amounted to €81.9 million (2022: €83.7 million). d) The acquisition costs of €4.8 million mainly related to contemplated acquisitions that would increase the perimeter of the Group. In the comparative period, the acquisition costs of €3.4 million related to the acquisitions of Spafid’s Issuer Services Business and the technology businesses of Nexi S.p.A. e) The non-underlying non-operating items comprised €53.0 million of gains on sales of the interests in associates LCH SA and Tokeny S.a.r.l., as well as a settlement payment of €0.2 million related to the finalisation of the sale of MTS Markets International Inc. at end of last year. The comparative period included a €2.3 million gain on sale of the interest in subsidiaries Finance Web Working SAS and MTS Markets International Inc. and a €1.5 million impairment of investment in joint venture LiquidShare. f) After the determination that an item is taxable, the tax impact of the Group’s non-underlying items of the individual entities of the Group to which the non-underlying items relate, is computed based on the tax rates applicable to the respective territories in which the entity operates. The Group uses its judgment to classify items as non-underlying. The determination of non-underlying items is not measured under EU-IFRS and should be considered in addition to, and not as a substitute for IFRS measures.
Year ended In thousands of euros 31 December
202331 December
2022Interest expense (effective interest method) (34,598) (36,587) Interest in respect of lease liabilities (1,085) (733) Other finance costs – 242 Underlying finance costs (35,683) (37,078) Non-underlying finance costs (31) – Total finance costs (35,714) (37,078) Interest income (effective interest method) 30,526 5,806 Total finance income 30,526 5,806 Interest income from interest rate swaps – 1,479 Gain / (loss) on disposal of treasury investments 4,721 (2,307) Net foreign exchange (loss)/gain 487 137 Other net financing result 5,208 (691) Total 20 (31,963) Underlying finance costs for the year, includes the full year impact of interest expenses on the Senior Unsecured Notes, that are held by the Group.
The recent evolution of ascending interest rates resulted in an increase of interest income (effective interest method), which is primarily incurred on the Group’s outstanding cash balances. The interest rates in the comparative period were at significantly lower levels.
Gain/(loss) on disposal of treasury investments includes the impact from changes in fair value of short-term investments in money market funds (see Notes 25 and 35).
The comparative period included interest income from interest rate swaps until the moment of termination of the interest rate swap agreements in May 2022 (see note 23).
The interest income and interest expenses from CCP clearing business assets and liabilities are shown in net treasury income through CCP business (see Note 8.2).
In 2023, dividend income relates to dividends received from the Group’s non-current equity investments at FVOCI in Euroclear S.A./N.V. and Sicovam Holding S.A.
In 2022, dividend income relates to dividends received from the Group’s non-current equity investments at FVOCI in Euroclear S.A./N.V.
On 6 July 2023, the Group sold its 11.1% investment in associate LCH SA to LCH Group Ltd for consideration of €111.0 million. The investment was held at a carrying amount of €69.4 million, resulting in a gain on disposal of €41.6 million.
On 1 December 2023, the Group sold its 18.93% investment in associate Tokeny S.a.r.l. for an amount of €11.4 million. As the investment was held at a carrying amount of zero million, the full proceeds of the sale were recognised in gain on disposal of associates.
In addition, current period was impacted by a settlement payment of €0.2 million related to the finalisation of the sale of subsidiary MTS Markets International Inc. at end of last year.
In the comparative period, the Group disposed its interests in subsidiaries Finance Web Working SAS and MTS Markets International Inc.
The proceeds from the sale of Finance Web Working SAS were €0.8 million (net of cash), which resulted in a loss on disposal of €0.8 million.
The proceeds from the sale of MTS Markets International Inc. were €7.8 million, whereas the combined net assets disposed of amounted to €4.7 million. This resulted in a gain on disposal of €3.1 million.
The actual tax charge incurred on the Group’s profit before income tax differs from the theoretical amount that would arise using the weighted average tax rates applicable to profit before income tax of the consolidated entities as follows:
Year ended In thousands of euros 31 December
202331 December
2022Profit before income tax 699,112 614,246 Income tax calculated at domestic tax rates applicable to profits in the respective countries (177,983) (148,079) Tax effects of: (De) recognition tax losses (a) (296) (543) Non-deductible expenses (b) (5,741) (204) Other tax exempt income (c) 25,025 (15) Over/(under) provided in prior years (d) (811) (4,450) Other (e) (2,891) (10,314) Total (162,697) (163,605) (a) De-recognition of tax losses relates to tax losses in Singapore as it is not considered probable at this moment that these deferred tax assets can be used to offset future taxable income. (b) In 2023 non-deductible expenses mainly relate to substitute tax paid in Italy relating to a goodwill step up, Italian tax on dividends of €2.1 million (2022: 3.1 million) and miscellaneous non-deductible expenses in the various jurisdictions. (c) In 2023 other tax exempt income mainly relates to dividends and sales proceeds from investments as well as the Italian notional interest deduction of €2.6 million (2022: 2.3 million). (d) ln 2023 and 2022, ’over/(under) provided in prior years’ relates to adjustments to tax following the filing of tax returns. (e) In 2023, Other includes tax surcharges of €2.0 million (in 2022: €2.3 million) in Portugal and France. As from 2023, Italian local taxes (IRAP) of €12.4 million (2022: 9.1 million) are reflected in the statutory tax rate, whereas in 2022 they were reported in ‘Other’. Furthermore, the line ‘Other’ includes an R&D credit of €1.2 million (2022: € 1.0 million). The effective tax rate decreased from 26.6% for the year ended 31 December 2022 to 23.3% for the year ended 31 December 2023.
The Group is within the scope of the OECD Pillar Two model rules. Pillar Two legislation was enacted in the Netherlands, the jurisdiction in which Euronext N.V. is incorporated, and will come into effect from 1 January 2024. Since the Pillar Two legislation was not effective at the reporting date, the group has no related current tax exposure.
The Group applies the exception to recognising and disclosing information about deferred tax assets and liabilities related to Pillar Two income taxes, as provided in the amendments to IAS 12 issued in May 2023.
Under the legislation, the Group is liable to pay a top-up tax for the difference between their GloBE effective tax rate per jurisdiction and the 15% minimum rate.
The Group has assessed its exposure to the Pillar Two legislation for when it comes into effect. The Group expects to apply the safe harbour provisions in all countries in which it operates, with the exception of Ireland. Ireland has a statutory tax rate of 12.5% and a qualifying domestic top up tax is expected to be due. However, this is not expected to be material. Therefore the overall assessment indicates that Pillar 2 is not expected to have a material impact on the Group in the foreseeable future.
In thousands of euros Land & Buildings Hardware & IT Other Equipment
(a)Total As at 31 December 2021 Cost 57,025 143,246 76,140 276,411 Accumulated depreciation and impairment (14,811) (108,099) (55,921) (178,831) Net book amount 42,214 35,147 20,219 97,580 As at 1 January 2022 net book amount 42,214 35,147 20,219 97,580 Exchange differences (1,079) (17) (66) (1,162) Additions 9,783 13,818 8,266 31,867 Disposals & other (1,189) 3,228 (2,116) (77) Transfers – 12,301 (12,301) – Acquisitions of subsidiaries – – – – Depreciation charge (Note 10) (1,230) (15,106) (2,483) (18,819) As at 31 December 2022 net book amount 48,499 49,371 11,519 109,389 As at 31 December 2022 Cost 60,528 164,215 69,771 294,514 Accumulated depreciation and impairment (12,029) (114,844) (58,252) (185,125) Net book amount 48,499 49,371 11,519 109,389 As at 1 January 2023 net book amount 48,499 49,371 11,519 109,389 Exchange differences (1,442) (104) (51) (1,597) Additions 1,115 21,795 4,793 27,703 Disposals & other – 3 (2) 1 Transfers – 828 216 1,044 Depreciation charge (Note 10) (1,409) (17,514) (3,244) (22,167) As at 31 December 2023 net book amount 46,763 54,379 13,231 114,373 As at 31 December 2023 Cost 59,908 177,670 77,036 314,614 Accumulated depreciation and impairment (13,145) (123,291) (63,805) (200,241) Net book amount 46,763 54,379 13,231 114,373 (a) Other Equipment includes building fixtures and fitting, lease improvements and work in progress. In 2023 and 2022, the additions in Property Plant and Equipment were primarily related to the investments made to the Oslo Børs building and purchases of Hardware and IT in relation to the data centre in Bergamo.
The transfer included in the comparative period, of €12.3 million from other equipment to hardware & IT mainly related to work in progress that was put into use at the go-live of the data centre in Bergamo in June 2022.
The Group leases offices in the various locations from which the Group operates its business, IT-hardware equipment such as data servers, racks and mainframes and leases of other equipment for use by its staff in offices. Leases of offices generally have an average lease term of 4 years, while hardware IT equipment generally have an average lease term of 3 years. Rental contracts are typically made for fixed periods, but may occasionally have extension options. Furthermore, the Group has very limited leases that contain variable lease payments and has no leases that are exposed to residual value guarantees. Payments associated with short-term leases (containing a lease term of 12 months or less) and leases of low-value assets are recognised on a straight-line basis as an expense in profit or loss.
Set out below are the carrying amounts of right-of-use assets recognised and the movements during the period:
Right-of-use assets In thousands of euros Building Equipment Other Total At 1 January 2022 50,190 15,978 – 66,168 Additions 1,068 1,122 – 2,190 Depreciation charge (see Note 10) (21,128) (4,888) – (26,016) Transfers – – – – Exchange impacts and other (11) (41) – (52) At 31 December 2022 30,119 12,171 – 42,290 Additions 37,781 769 – 38,550 Depreciation charge (see Note 10) (20,007) (4,958) – (24,965) Transfers – – – – Exchange impacts and other (146) 10 – (136) At 31 December 2023 47,747 7,992 – 55,739 In thousands of euros 2023 2022 At 1 January 50,114 71,684 Additions 37,924 1,904 Acquisition of subsidiary – – Accretion of interest 1,085 733 Payments (29,508) (24,150) Exchange impacts and other (142) (57) At 31 December 59,473 50,114 Of which are: Non-current lease liabilities 37,314 21,648 Current lease liabilities 22,159 28,466 (a) The figures for the comparative period were adjusted, as these were onerously reflecting ‘discounted’ lease liabilities, whereas ‘undiscounted’ lease liabilities should have been disclosed. In thousands of euros 2023 2022 Depreciation charge of right-of-use assets Building (20,007) (21,127) Equipment (4,958) (4,888) Other – – Interest expense (included in finance cost) (1,085) (733) Expenses related to short-term leases (included in other operational expenses) (221) (289) Expenses related to leases of low-value asset (included in other operational expenses) (1,046 (920) Total (27,317) (27,957) The total cash outflow for leases in 2023 was €29.7 million (2022: €24.6 million). The Group’s exposure to potential future cash outflows related to variable lease payments, extension or termination options and residual value guarantees was not material.
Fair value adjustment
Intangible assets
recognised on
acquisition of subsidiariesIn thousands of euros Goodwill Internally
developed
softwarePurchased
softw.
Constr. in
Pr.
Patents &
TrMrSoftware Customer
RelationsBrand
Names (b)Total As at 31 December 2021 Cost 4,037,560 184,136 220,022 171,228 2,048,011 37,675 6,698,632 Accumulated amortisation and impairment (54,369) (108,976) (198,249) (42,729) (71,250) (7,215) (482,788) Net book amount 3,983,191 75,160 21,773 128,499 1,976,761 30,460 6,215,844 As at 1 January 2022 net book amount 3,983,191 75,160 21,773 128,499 1,976,761 30,460 6,215,844 Exchange differences (18,425) (31) (4) (1,094) (7,792) 204 (27,142) Additions – 66,348 1,302 – – – 67,650 Impairment charge / write off – – – – – – – Transfers and other – 372 295 – – – 667 Acquisitions of subsidiaries 60,257 – – 448 5,621 – 66,326 Sales of subsidiaries (2,163) – – – – – (2,163) Amortisation charge (Note 10) – (24,922) (6,871) (21,540) (60,276) (1,747) (115,356) As at 31 December 2022 net book amount 4,022,860 116,927 16,495 106,313 1,914,314 28,917 6,205,826 As at 31 December 2022 Cost 4,077,182 268,349 218,380 157,924 2,044,521 31,828 6,798,184 Accumulated amortisation and impairment (54,322) (151,422) (201,885) (51,611) (130,207) (2,911) (592,358) Net book amount 4,022,860 116,927 16,495 106,313 1,914,314 28,917 6,205,826 As at 1 January 2023 net book amount 4,022,860 116,927 16,495 106,313 1,914,314 28,917 6,205,826 Exchange differences (34,696) (458) (65) (1,426) (13,283) (420) (50,348) Additions – 74,909 424 – – – 75,333 Impairment charge / write off – – – – – – – Transfers and other (a) – 8,329 (10,234) – – – (1,905) Acquisitions of subsidiaries (c) (Note 5) (11,160) – – 10,137 3,268 – 2,245 Sales of subsidiaries – – – – – – – Amortisation charge (Note 10) – (36,976) (2,468) (22,239) (59,569) (1,747) (122,999) As at 31 December 2023 net book amount 3,977,004 162,731 4,152 92,785 1,844,730 26,750 6,108,152 As at 31 December 2023 Cost 4,031,263 477,832 74,783 165,548 2,032,571 31,408 6,813,405 Accumulated amortisation and impairment (54,259) (315,101) (70,631) (72,763) (187,841) (4,658) (705,253) Net book amount 3,977,004 162,731 4,152 92,785 1,844,730 26,750 6,108,152 a) Following review of the intangible assets related to Borsa Italiana Group, the Group has transferred ‘Purchased software’ to ‘Internally developed software’ at a net book value of €10.4 million, as these intangible assets were onerously included as ‘Purchased software’ when their correct classification is ‘Internally developed software’.
b) As per 31 December 2023, brand names include brands with a finite useful live for an amount of €0.9 million (2022: €3.6 million).
c) Includes the impact of the finalisation of the purchase price allocation related to the acquisition of Nexi S.p.A. technology businesses, as explained in Note 5.
In 2023, the additions in internally developed software investments primarily related to the ongoing implementation of Borsa Italiana Group to Euronext’s trading platform Optiq®, the expansion of clearing activities to all Euronext markets by Euronext Clearing, the pan-Europeanisation of Euronext CSDs, and several digital ambition projects within the Group. Furthermore, no indicators of impairment of intangible assets with a finite useful life were identified and as such no detailed impairment test was performed. For intangible assets with an indefinite useful life the impairment tests did not lead to an/any impairment.
Goodwill is monitored and tested for impairment at the lowest CGU Group level of the Group to which goodwill acquired in a business combination is allocated (see Note 3). Following the acquisitions of Euronext FX (former FastMatch Inc.) in 2017 and Nord Pool Holding AS in 2020 and the allocation of goodwill from those transactions to respectively the “FX Trading” CGU and the “Nord Pool” CGU, the Group tests goodwill at the level of three CGUs (Groups): “Euronext”, “FX Trading” and “Nord Pool”. The acquisition of Borsa Italiana Group is included in the Euronext CGU.
The recoverable value of the “Euronext” CGU Group is based on its fair value less cost of disposal, applying a discounted cash flow approach, and corroborated by observation of Company’s market capitalisation. The fair value measurement uses significant unobservable inputs and is therefore categorised as a Level 3 measurement under IFRS 13.
Cash flow projections are derived from the 2024 budget and the business plan for 2025. Key assumptions used by management include third party revenue growth, which factors future volumes of European equity markets, the Group’s market share, average fee per transaction, and the expected impact of new product initiatives. These assumptions are based on past experience, market research and management expectation of market developments.
For the impairment test performed as of 31 December 2023, revenues have been extrapolated using a perpetual growth rate of 1.5% (2022: 1.4%) after 2024. The weighted average cost of capital applied was 7.5% (2022: 7.2%).
The annual impairment testing of the “Euronext” CGU Group performed at each year-end did not result in any instance where the carrying value of the operating segment exceeded its recoverable amount. Recoverable amount is sensitive to key assumptions. As of 31 December 2023, a reduction to 0% per year of perpetual growth rate, or an increase by 1% per year in discount rate, which management believes are individually reasonably possible changes to key assumptions, would not result in a goodwill impairment. The sensitivity test on the key assumptions defined in 2023 would not result in a goodwill impairment. Possible correlations between each of these parameters were not considered.
The recoverable value of the “FX Trading” CGU is based on its fair value less cost of disposal, applying a discounted cash flow approach. The fair value measurement uses significant unobservable inputs and is therefore categorised as a Level 3 measurement under IFRS 13.
Cash flow projections are derived from the 2024 budget, the business plan for 2025 and extrapolations for 2026 to 2030. Key assumptions used by management include third party revenue growth, which factors future volumes on global Foreign Exchange trading markets, the Group’s market share, average fee per transaction, and the expected impact of new product initiatives. These assumptions are based on past experience, market research and management expectation of market developments.
For the impairment test performed as of 31 December 2023, revenues have been extrapolated using a perpetual growth rate of 2.0% (2022: 2.0%) after 2030. The discount rate applied was 7.5% (2022: 7.5%).
The annual impairment testing of the “FX Trading” CGU performed at each year-end did not result in any instance where the carrying value of the operating segment exceeded its recoverable amount. Recoverable amount is sensitive to key assumptions. As of 31 December 2023, a reduction to 0% per year of perpetual growth rate, or an increase by 1% per year in discount rate, which management believes are individually reasonably possible changes to key assumptions, would not result in a goodwill impairment. The sensitivity test on the key assumptions defined in 2023 would not result in a goodwill impairment. Possible correlations between each of these parameters were not considered.
The recoverable value of the “Nord Pool” CGU is based on its fair value less cost of disposal, applying a discounted cash flow approach. The fair value measurement uses significant unobservable inputs and is therefore categorised as a Level 3 measurement under IFRS 13.
Cash flow projections are derived from the 2024 budget, the business plan for 2025 and extrapolations for 2026 to 2030. Key assumptions used by management include third party revenue growth, which factors future volumes on day ahead and intraday physical energy markets, the Group’s market share, average fee per transaction, and the expected impact of new product initiatives. These assumptions are based on past experience, market research and management expectation of market developments.
For the impairment test performed as of 31 December 2023, revenues have been extrapolated using a perpetual growth rate of 1.4% (2022: 1.3%) after 2030. The discount rate applied was 7.5% (2022: 7.5%).
The annual impairment testing of the “Nord Pool” CGU performed at year-end did not result in any instance where the carrying value of the operating segment exceeded its recoverable amount. Recoverable amount is sensitive to key assumptions. As of 31 December 2023, a reduction to 0% per year of perpetual growth rate, or an increase by 1% per year in discount rate, which management believes are individually reasonably possible changes to key assumptions, would not result in a goodwill impairment. The sensitivity test on the key assumptions defined in 2023 would not result in a goodwill impairment. Possible correlations between each of these parameters were not considered.
(a) As shown in the balance sheet, after offsetting deferred tax assets and liabilities related to the same taxable entity. In thousands of euros 2023 2022 Deferred tax assets / (liabilities): Property, plant and equipment (477) (2,384) Intangible assets (a) (523,616) (552,237) Investments (b) (31,628) (28,321) Provisions and employee benefits 24,232 12,975 Other (c) 30,158 36,272 Loss carried forward (d) 694 38 Deferred tax assets (net) (500,637) (533,657) (a) The balance mainly relates to the recognition of a deferred tax liability resulting from the intangible assets recognised upon the acquisition of Borsa Italiana Group in 2021. (b) The investments mainly relate to the valuation of assets measured at fair value through other comprehensive income (FVOCI). (c) The line ‘Other’ primarily relates to the tax impact from contract liabilities of €15.6m million (2022: €20.2 million), currency movements on intercompany loans (NOK, GBP and USD) of € 8.2m million (2022: €7.4 million) and intra group accrued unpaid interest of €5.5 million (2022: €6.9 million). (d) Losses carry forward relate mainly to tax losses carry forward recognised by investments in Italy and Germany. With effect from 1 April 2023, the United Kingdom’s corporate tax rate increased to 25% (2022: 19%). The deferred tax assets and liabilities have been recognised at prevailing rates in the various countries.
In thousands of euros 2023 2022 Balance at beginning of the year (533,657) (554,942) Recognised in income statement 28,533 15,316 Reclassifications and other movements (a) (36) 10,499 Exchange differences and other 3,187 4,921 Charge related to other comprehensive income 1,336 (9,451) Balance at end of the year (500,637) (533,657) (a) In 2022, the line ‘Reclassifications and other movements’ includes rate impacts that affected the deferred tax liability resulting from the intangible assets recognised upon the acquisition of Borsa Italiana Group in 2021. As per 31 December 2023, tax losses totalling €29.4 million (2022: €29.8 million) were not recognised in the UK and Singapore since it is not considered probable, at this moment, that these deferred tax assets can be used to offset future taxable income.
The majority of the net deferred tax asset is expected to be recovered or settled after more than twelve months.
The Group’s financial assets at fair value through other comprehensive income include long-term investments in unlisted equity securities, which the Group has irrevocably elected at initial recognition to recognise in this category. In addition, debt securities allocated to the “hold and sell” business model are included in this category. The classification of the measurement within the fair value hierarchy is presented in Note 35.
As of 31 December 2023, the Group holds a 3.53% ownership interest in Euroclear S.A./N.V. (31 December 2022: 3.53%), an unlisted company involved in the settlement of securities transaction and related banking services. The Group also holds a 9.60% ownership interest in Sicovam Holding S.A. (31 December 2022: 9.60%), resulting in an indirect 1.53% interest in Euroclear S.A./N.V. (31 December 2022: 1.53%). The common stock of Sicovam Holding S.A. and Euroclear S.A./N.V. are not listed.
For measuring fair value of its long-term investments in unlisted equity securities in Euroclear S.A/N.V. and Sicovam Holding S.A., the Group applies a weighted approach, using both the Gordon Growth Model (with return on equity and expected dividend growth rate as key non-observable parameters) and recent observed market transactions taking into account an illiquidity discount for the limited number of transactions.
In 2023, this valuation method resulted in a total valuation of Euroclear S.A./N.V. of €5.3 billion (2022: €5.0 billion), and to an increase in fair value of Euronext N.V./S.A.’s direct- and indirect investments of €11.7 million (2022: €42.0 million) in 2023. This revaluation was recorded in Other Comprehensive Income.
In 2023, the Group made an investment in EuroCTP B.V. (incorporated on 23 August 2023), which is a joint initiative of currently 14 European exchanges, respectively exchange groups. EuroCTP B.V. aims to participate in the future selection process for the provision of a consolidated tape (CT) for equities in the European Union.
During 2023, the €28.5 million of long-term investments in secured assets linked to Euronext Clearing’s own funds were reclassified to ‘other current financial assets’ in accordance with their maturity.
These investments consisted of Government Bonds issued by the States of Belgium, France, Ireland, Italy, Holland, Portugal and Spain; and Supranational Securities issued by the European Stability Mechanism and the European Financial Stability Facility, as well as by securities issued by Spanish (Instituto de Credito Oficial) and French (Caisse d’Amortissement de la Dette Sociale) government agencies.
These debt investments were valued at public market prices, with changes in fair value recognised through Other Comprehensive Income.
In thousands of euros 2023 2022 Trade receivables 262,975 271,829 Contract receivables 29,259 32,096 Allowance for expected credit losses (8,585) (7,348) Trade and contract receivables net 283,649 296,577 Tax receivables (excluding income tax) 13,131 8,214 Other receivables 6,735 13,296 Total 303,515 318,087 Trade receivables are non-interest bearing and generally on terms of 30 to 90 days. Contract receivables represent amounts in respect of unbilled revenue, for which the Group has an unconditional right to consideration (i.e. only the passage of time is required before payment of the consideration is due).
Set out below is the movement in the allowance for expected credit losses of trade and contract receivables:
Management considers the fair value of the trade and other receivables to approximate their carrying value. The significant changes in loss allowance provision are disclosed in Note 8.1.2. The information about the credit exposures of trade and other receivables are disclosed in Note 37.5.1.
The Group may use derivative instruments to manage financial risks relating to its financial positions or risks relating to its ongoing business operations. The Group’s risk management strategy and how it is applied to manage risk is further explained in Note 37.
As per 31 December 2023, the derivative financial liability balance includes an impact of €34k (2022: €19k) in Nord Pool related to the effects of foreign exchange spot transactions made to facilitate electricity settlement.
Until 3 May 2022, the Group had three interest rate swap agreements in place with a total notional amount of €500.0 million whereby the Group received an annual fixed interest rate of 1% and paid a variable rate of six-month EURIBOR, plus a weighted average spread of 0.3825%. The rate applicable to the floating leg of the swap for the aggregated notional amount of €500.0 million was -0.141%. The swaps were being used to reduce the variability of the fair value of the 1% fixed rate Bond (Senior Unsecured note #1) attributable to the change in interest rate, allowing it to transform the fixed rate exposure to floating rate.
There was an economic relationship between the hedged item and the hedging instrument as the terms of the interest rate swaps matched the terms of the fixed rate Bond (i.e., notional amount, maturity, payment and reset dates). The Group had established a hedge ratio of 1:1 for the hedging relationships as the underlying risk of the interest rate swap was identical to the hedged risk component. To assess the hedge effectiveness, the Group compared the changes in the fair value of the hedging instrument against the changes in fair value of the hedged item attributable to the hedged risk.
On 3 May 2022, the Group terminated its interest rate swap agreements. On termination, the Group cash settled the swap agreements at a carrying amount of €8.9 million and the hedge relationship was discontinued. The accumulated fair value adjustments of €7.7 million will be amortised over the remaining term of the Senior Unsecured Note #1.
During 2023, approximately €2.6 million was amortised, reducing the amount of accumulated fair value adjustments to €3.3 million as at 31 December 2023 (2022: €5.9 million) (see Note 29).
In 2022, the impact of respectively the hedging instrument and the hedged item on the balance sheet immediately before termination of the interest rate swap agreements was as follows:
In thousands of euros Notional amount Carrying amount Line item in the balance
sheetChange in fair value used for measuring
ineffectiveness for the periodInterest rate swaps 500,000 (8,886) Derivative financial
instruments
(20,787) In thousands of euros Carrying amount Accumulated fair
value
adjustmentsLine item in the balance
sheetChange in fair value used for measuring
ineffectiveness for the periodSenior Unsecured note #1 492,352 (7,648) Non-current
Borrowings
(20,787) As the hedge was effective, no amounts for ineffectiveness were recognised in ‘hedging result’ in the Statement of Profit or Loss for the year ended 31 December 2022 (see Note 13).
Set out below is the reconciliation of each component of equity and the analysis of Other Comprehensive Income:
In thousands of euros Foreign
currency
translation
reserveAs at 1 January 2022 (10,631) Changes in fair value of the hedging instrument – Foreign exchange forward point excluded from the hedge – Foreign currency revaluation of the net foreign operations a) (26,169) As at 31 December 2022 (36,800) Changes in fair value of the hedging instrument – Foreign exchange forward point excluded from the hedge – Foreign currency revaluation of the net foreign operations a) (50,545) As at 31 December 2023 (87,345) (a) The impact was almost fully attributable to foreign currency translations of net foreign operations in NOK The other current financial assets of the Group consist of short-term deposits with a maturity of more than three months, short-term investments in government bonds including those linked to Euronext Clearing’s own funds (see Note 20) and investments in listed bonds held by Euronext Securities Copenhagen.
Short-term investments are presented as cash and cash equivalents if they have a maturity of three months or less from the date of acquisition and are repayable with 24 hours’ notice with no loss of interest. Cash and cash equivalents included an amount of €42.0 million (2021: €47.6 million) for the purpose of the settlement of power purchases at Nord Pool.
The short-term investments in money market funds are measured at fair value with gains and losses arising from changes in fair value included in profit or loss (see Notes 13 and 35).
Under the Articles of Association, the Company’s authorised share capital amounts to €200,000,001.60 and is divided into 125,000,000 Ordinary Shares and one Priority Share, each with a nominal value of €1.60 per share. All of Euronext’s shares have been or will be created under Dutch law.
As of 31 December 2023, the Company’s issued share capital amounts to €171,370,070 and is divided into 107,106,294 Ordinary Shares. The Priority Share is currently not outstanding. The fully paid ordinary shares carry one vote per share and rights to dividends, if declared. The Group’s ability to declare dividends is limited to distributable reserves as defined by Dutch law.
(in numbers of shares) 2023 2022 Issued shares 107,106,294 107,106,294 Treasury shares as at 1 January (378,531) (524,629) Liquidity contract – – Share buy back (3,176,382) – From share-based payments vesting 114,787 146,098 Treasury shares as at 31 December (3,440,126) (378,531) Outstanding as at 31 December 103,666,168 106,727,763 The movement on the line ‘acquisitions of own shares’ in the Consolidated Statement of Changes in Equity consists of the impact from transactions by the liquidity provider of €55k gain (2022: €18k loss), minus the impact from transactions under the share repurchase programme, which was €219.1 million in 2023, (2022: nil). Details of these movements are disclosed below at (i) and (ii).
Part of the movement in the reserve during the reporting period relates to the transactions in Euronext N.V. shares conducted by the liquidity provider on behalf of the Group under the liquidity contract established (€55k gain in 2023).
The liquidity Agreement (the “Agreement”) has been established in accordance with applicable rules, in particular the Regulation (EC) 2273/2003 of the European Commission of 22 December 2003 implementing the directive 2003/6/EC of the European Parliament and Council as regards exemptions for buyback programs and stabilisation of financial instruments, the provisions of article 2:95 of the Book II of Dutch civil code, the provisions of the general regulation of the French Autorité des Marchés Financiers (the “AMF”), the decision of the AMF dated 21 March 2011 updating the Accepted Market Practice n° 2011-07 on liquidity agreements, the Code of Conduct issued by the French Association française des marchés financiers (AMAFI) on 8 March 2011 and approved by the AMF by its aforementioned decision dated 21 March 2011 (the “AMAFI Code”) and as the case maybe the relevant Dutch rules applicable to liquidity agreements in particular the regulation on Accepted Market Practices WFT (Regeling gebruikelijke marktpraktijken WFT) dated 4 May 2011 and Section 2.6 of the Book II - General Rules for the Euronext Amsterdam Stock Market (the “Dutch Rules”).
Transaction date Buy Euronext
N.V. sharesSell Euronext
N.V. sharesAverage
share priceTotal value transaction
including commissions(in euro) As at 31 December 2021 – Purchases January 50,430 €86.20 4,346,842 Sales January 50,430 €86.16 (4,345,058) Purchases February 42,459 €82.80 3,515,798 Sales February 38,459 €82.87 (3,186,915) Purchases March 51,553 €83.06 4,282,240 Sales March 47,553 €82.73 (3,933,924) Purchases April 43,858 €80.92 3,549,208 Sales April 43,858 €81.96 (3,594,457) Purchases May 61,210 €75.78 4,638,734 Sales May 69,010 €76.23 (5,260,289) Purchases June 48,782 €77.14 3,763,233 Sales June 48,982 €77.18 (3,780,611) Purchases July 62,573 €76.92 4,813,310 Sales July 62,523 €77.04 (4,816,844) Purchases August 57,942 €78.21 4,531,678 Sales August 51,192 €78.35 (4,010,797) Purchases September 31,960 €69.97 2,236,211 Sales September 25,160 €70.05 (1,762,464) Purchases October 15,324 €64.12 982,635 Sales October 13,923 €64.70 (900,879) Purchases November 30,696 €68.35 2,098,224 Sales November 45,197 €68.84 (3,111,330) Purchases December 36,983 €71.33 2,638,130 Sales December 37,483 €71.37 (2,675,171) Total buy/sell 533,770 533,770 17,501 Total as at 31 December 2022 – Transaction date Buy Euronext
N.V. sharesSell Euronext
N.V. sharesAverage
share priceTotal value transaction
including commissions(in euro) As at 31 December 2022 – Purchases January 66,500 € 73.61 4,895,070 Sales January 66,300 € 73.70 (4,886,622) Purchases February 61,534 € 75.66 4,655,680 Sales February 58,934 € 75.94 (4,475,742) Purchases March 101,923 € 70.39 7,174,022 Sales March 104,723 € 70.53 (7,385,685) Purchases April 53,366 € 71.42 3,811,563 Sales April 53,361 € 71.44 (3,811,950) Purchases May 79,555 € 68.17 5,422,932 Sales May 70,810 € 68.91 (4,879,728) Purchases June 75,846 € 63.90 4,846,407 Sales June 70,596 € 63.79 (4,503,436) Purchases July 68,682 € 63.64 4,371,225 Sales July 82,682 € 63.76 (5,271,810) Purchases August 66,277 € 67.29 4,459,572 Sales August 63,677 € 67.38 (4,290,633) Purchases September 68,583 € 65.19 4,471,029 Sales September 71,083 € 65.28 (4,640,341) Purchases October 62,203 € 66.31 4,124,409 Sales October 58,303 € 66.21 (3,860,215) Purchases November 131,049 € 72.95 9,559,399 Sales November 135,049 € 72.83 (9,835,000) Purchases December 209,256 € 77.89 16,298,419 Sales December 209,256 € 77.91 (16,303,186) Total buy/sell 1,044,774 1,044,774 (54,621) Total as at 31 December 2023 — The Group has entered into a discretionary management agreement with a bank to repurchase Euronext shares within the limits of relevant laws and regulations (in particular EC regulation 2273/2003) and the Group’s articles of association to cover the Group’s outstanding obligations resulting from employee shares plans for 2020, 2021, 2022 and 2023. The share repurchase programme aims to hedge price risk arising for granted employee share plans.
In addition, on 27 July 2023, the Group announced a share repurchase programme (the ‘Programme’) for an amount of €200 million (see Note 2). The Programme will be executed in compliance with applicable rules and regulations, including the Market Abuse Regulation 596/2014 and the Commission Delegated Regulation (EU) 2016/1052, and based on the authority granted by the annual general meeting of shareholders on 17 May 2023.
In 2023, the Group repurchased 3,176,382 shares for a total consideration of €219.1 million. In 2022, the Group repurchased no shares.
Transaction date Buy Euronext N.V.
sharesAverage share
priceTotal value transaction including
commissions(in euro) Purchases June 218,500 €64.41 14,073,095 Purchases July 111,500 €62.53 6,971,908 Purchases August 427,018 €67.27 28,726,646 Purchases September 479,649 €65.42 31,377,708 Purchases October 725,987 €66.40 48,205,756 Purchases November 712,401 €71.43 50,890,209 Purchases December 501,327 €77.53 38,869,996 Total buy/sell 3,176,382 219,115,318 Total as at 31 December 2023 3,176,382 219,115,318 In 2023, the Group delivered 114,787 shares with a cost of €9.8 million to employees for whom share plans had vested (2022: 146,098 shares with a cost of €9.7 million). This movement is disclosed on the line ‘Other’ in the Consolidated Statement of Changes in Equity.
Retained earnings are not freely available for distribution for an amount of €72.9 million (2022: €59.8 million) relating to legal reserves (see Note 53).
On 17 May 2023, the Annual General Meeting of shareholders voted for the adoption of the proposed €2.22 dividend per ordinary share, representing a 50% pay-out ratio of net profit adjusted for the net loss realized on the Euronext Clearing Investment portfolio amounting to €35.3 million. On 25 May 2023, the dividend of €237.2 million was paid to the shareholders of Euronext N.V.
Basic earnings per share is calculated by dividing the profit for the period attributable to the shareholders of the Company by the weighted average number of ordinary shares outstanding during the period.
Diluted earnings per share is calculated by dividing the profit for the period attributable to the shareholders of the Company by the weighted average number of ordinary shares outstanding during the period plus the weighted average number of ordinary shares that would be issued on conversion of all the dilutive potential ordinary shares into ordinary shares.
The following table reflects the income and share data used in the basic and diluted EPS calculations:
In thousands of euros 2023 2022 Profit attributable to the shareholders of the Company 513,567 437,827 In number of shares Weighted average number of ordinary shares for basic EPS (a) 106,051,799 106,669,451 Effects of dilution from: Share plans 324,539 231,855 Weighted average number of ordinary shares adjusted for the effect of dilution (a) 106,376,338 106,901,306 (a) The weighted average number of shares takes into account the weighted average effect of changes in treasury shares during the year.
The impact of share plans is determined by the number of shares that could have been acquired at fair value (determined as the average quarterly market price of Euronext’s shares) based on the fair value (measured in accordance with IFRS 2) of any services to be supplied to Euronext in the future under these plans.
There have been no other transactions involving ordinary shares or potential ordinary shares between the reporting date and the date of authorisation of these financial statements.
Directors and certain employees of the Group benefited from Restricted Stock Units (RSUs) granted by Euronext N.V. under the LTI Plans on their applicable grant dates. RSUs granted under LTI Plans cliff-vest after 3 years, subject to continued employment and a ‘positive EBITDA1’ performance condition. These equity awards are measured by reference to the grant-date market price of Euronext’s common share (grant-date fair value).
In addition to these RSUs granted to all participants in the LTI Plans, Performance RSUs have been awarded to members of the Managing Board and Senior Leadership team. The vesting of these Performance RSUs is subject to two performance conditions:
■ 50% of the performance RSUs vests subject to a Total Shareholder Return (TSR) condition; ■ 50% of the performance RSUs vests subject to an EBITDA1-based performance condition. The grant-date fair value of performance shares with a TSR performance condition was adjusted for the possible outcomes of this condition. This has been assessed by applying a Monte Carlo simulation to model possible share prices of Euronext and its peer companies. At the end of each reporting period, the number of vesting performance shares is reconsidered based on the Group’s EBITDA1 performance relative to budgeted EBITDA1 and the total cost for the performance RSUs could be adjusted accordingly. Grant-date fair value of RSUs granted under the LTI Plans 2021, 2022 and 2023 reflect the present value of expected dividends over the vesting period.
Plan Year
of
grant1 January 2022 Granted Adjusted (a) Vested Forfeited 31 December
2022Fair value at
grant date per
share
(in €)LTI, with performance 2019 72,020 – 66,995 (139,015) – – €68.30 LTI, no performance 2019 50,859 – – (48,807) (2,052) – €57.94 LTI, with performance 2020 72,056 – – – (5,413) 66,643 €110.64 LTI, no performance 2020 46,891 – – – (5,101) 41,790 €81.30 LTI, with performance (b) 2021 78,435 – – – (5,080) 73,355 €74.84 LTI, no performance (b) 2021 64,711 – – – (7,239) 57,472 €79.98 LTI, with performance (c) 2021 22,963 – – – (1,462) 21,501 €71.72 LTI, with performance (c) 2021 6,350 – – – (580) 5,770 €86.64 LTI, with performance 2022 – 108,229 – – (2,153) 106,076 €78.59 LTI, no performance 2022 – 89,187 – – (4,293) 84,894 €72.72 Total 414,285 197,416 66,995 (187,822) (33,373) 457,501 Plan Year
of
grant1 January 2023 Granted Adjusted (a) Vested Forfeited 31 December
2023Fair value at
grant date
per share
(in €)LTI, with performance 2020 66,643 – 32,059 (98,702) – – €110.64 LTI, no performance 2020 41,790 – – (39,945) (1,845) – €81.30 LTI, with performance (b) 2021 73,355 – – – (1,051) 72,304 €74.84 LTI, no performance (b) 2021 57,472 – – (10) (4,911) 52,551 €79.98 LTI, with performance (c) 2021 21,501 – – – (1,192) 20,309 €71.72 LTI, with performance (c) 2021 5,770 – – (10) (550) 5,210 €86.64 LTI, with performance 2022 106,076 – – – (2,786) 103,290 €78.59 LTI, no performance 2022 84,894 – – (20) (6,399) 78,475 €72.72 LTI, with performance 2023 – 138,360 – – (1,051) 137,309 €57.21 LTI, no performance 2023 – 119,076 – – (2,565) 116,511 €59.99 Total 457,501 257,436 32,059 (138,687) (22,350) 585,959 Euronext has taken into consideration the fact that the employees will not receive dividends during the vesting period of 3 years. The fair value has been adjusted taking into account the financial loss for the participants to not receive the payment of the dividends during the vesting period.
Share-based payment expenses recognised in the income statement for shares granted for all plans to directors and selected employees in 2023 amounted to €14.4 million (2022: €14.0 million), see Note 9.
In thousands of euros 2023 2022 Non-current Borrowings Senior Unsecured note #1 (a) 496,640 494,048 Senior Unsecured note #2 750,000 750,000 Senior Unsecured note #3 600,000 600,000 Senior Unsecured note #4 600,000 600,000 Senior Unsecured note #5 600,000 600,000 Discount, premium and issue costs (21,929) (21,929) Amortisation discount, premium and issue costs 6,918 5,042 Other – – Total 3,031,629 3,027,161 Current Borrowings Accrued interest 17,286 17,370 Total 17,286 17,370 (a) The Senior Unsecured Note #1 is carried at amortised cost and was adjusted for fair value movements due to the hedged interest rate risk until 3 May 2022 (see Note 23). On 3 May 2022, the Group terminated its interest rate swap agreements which were formally designated and qualified as fair value hedges of Senior Unsecured Note #1. On termination, the Group cash settled the swap agreements and the hedge relationship was discontinued.
As from the moment of discontinuation of the fair value hedge, the accumulated fair value adjustments of Senior Unsecured Note #1 is amortised to profit or loss based on a recalculated Effective Interest Rate over the remaining term of Senior Unsecured Note #1. The accumulated fair value adjustments amounted to a negative €3.3 million as per 31 December 2023 (2022: €5.9 million).
On 12 October 2022, the Group executed its two-year extension option to the revolving credit facility agreement (RCF) of €600.0 million. The RCF allows the Group to apply all amounts borrowed by it towards (i) general corporate and/or working capital purposes of the Group, (ii) satisfaction of the consideration payable for an acquisition and/or (iii) the payment of fees, costs and expense incurred in relation to an acquisition. The revolving credit facility has a remaining maturity of 4 years (November 2027) and bears an interest rate of EURIBOR plus a margin dependent on rating. As per 31 December 2023, the facility remained undrawn.
In case of a downgrading event of Euronext, below BBB- or equivalent by rating agencies, Euronext shall ensure that the leverage ratio (Euronext total net debt to EBITDA2) as defined in the Revolving Credit Facility Agreement would not be greater than 4x.
The Group operates defined benefit pension plans for its employees, with the most significant plans being in France, Portugal, Norway and Italy. The Group’s plans are funded by contributions from the employees and the relevant Group entities, taking into account applicable government regulations and the recommendations of independent, qualified actuaries. The majority of plans have plan assets held in trusts, foundations or similar entities, governed by local regulations and practice in each country. The assets for these plans are generally held in separate trustee administered funds. The benefits provided to employees under these plans are based primarily on years of service and compensation levels.
The French plans relate almost completely to retirement indemnities. French law stipulates that employees are paid retirement indemnities in form of lump sums on the basis of the length of service at the retirement date and the amount is prescribed by collective bargaining agreements.
The Portuguese plan is for both Euronext Lisbon and Interbolsa and is managed by CGD Pensoes – Sociedade Gestora de Fundos de Pensoes SA. The plan was defined benefit based on final pay. The funds covered payment of pensions to employees with a minimum of 5 year service. Annual contributions were based on actuarial calculations. In 2017, the Portuguese defined benefit plan was frozen and replaced by a new defined contribution plan, with an retroactive impact as from 1 January 2017. The old arrangement remains a defined benefit plan, and is disclosed as such in this Note.
The Norwegian plans relate to Oslo Børs VPS and Nord Pool. The plan in Oslo Børs VPS comprises both defined benefit schemes and defined contribution schemes. The general pension plan for employees in Norway is a defined contribution scheme. The defined benefit schemes are mainly related to lifetime pensions for former CEOs of Oslo Børs and VPS, as well as a voluntary early retirement scheme for Oslo Børs which was closed in 2003. Nord Pool has a defined benefit pension plan involving two former employees for which contributions are made in accordance with actuarial calculations. The Norwegian pension plans are in compliance with the Mandatory Occupational Pensions Act.
The Italian plan relates to the Borsa Italiana Group. Following the entry into force of the 2007 Finance Act and related decrees, the severance indemnity (TFR), maturing 1st January 2007 can no longer be retained by the companies that employ more than 50 employees but must be paid to a pension fund or, alternatively, into an open treasury fund opened at the ‘National Institute for Social Security’ (INPS), according to the option exercised by the employees themselves. This implies that accruals calculated after 1st January 2007 are part of a defined contribution plan because the company’s obligation is satisfied by the payment of contributions to pension funds or INPS. The liability regarding the severance indemnity prior to the date mentioned above shall instead continue to represent a defined benefit plan to be valued applying the actuarial method based on the provisions set forth in IAS 19 and is disclosed as such in this Note.
In thousands of euros Present value of
obligationFair value of plan
assetsTotal As at 1 January 2022 56,112 (23,989) 32,123 (Income) / expense: Current service cost 1,431 – 1,431 Interest expense / (income) 730 (306) 424 2,161 (306) 1,855 Remeasurements: - Return on plan assets, excluding amounts included in interest expense / (income) – 2,331 2,331 - (Gain) / loss from change in financial assumptions (12,768) – (12,768) - Experience (gains) / losses (959) – (959) - Effect of changes in foreign exchange rates and other (509 9 (500) (14,236) 2,340 (11,896) Payments and other significant events: - Employer contributions (1,796) – (1,796) - Benefit payments (415) 282 (133) - Acquired in business combination – – – - Reclassifications and other (522) – (522) As at 31 December 2022 41,304 (21,673) 19,631 (Income) / expense: Current service cost 2,491 – 2,491 Interest expense / (income) 1,515 (857) 658 4,006 (857) 3,149 Remeasurements: - Return on plan assets, excluding amounts included in interest expense / (income) – (1,131) (1,131) - (Gain) / loss from change in financial assumptions 1,804 – 1,804 - Experience (gains) / losses 661 – 661 - Effect of changes in foreign exchange rates and other (12) 44 32 2,453 (1,087) 1,366 Payments and other significant events: - Employer contributions (1,666) – (1,666) - Benefit payments (301) 228 (73) - Acquired in business combination 700 222 922 - Reclassifications and other (652) – (652) As at 31 December 2023 45,844 (23,167) 22,677 2023 In thousands of euros Belgium Portugal France Norway Italy Total Present value of obligation 25 18,825 9,481 11,427 6,086 45,844 Fair value of plan assets – (18,689) (4,087) (391) – (23,167) Total 25 136 5,394 11,036 6,086 22,677 2022 In thousands of euros Belgium Portugal France Norway Italy Total Present value of obligation 24 16,762 7,630 12,332 4,556 41,304 Fair value of plan assets – (17,145) (3,912) (616) – (21,673) Total 24 (383) 3,718 11,716 4,556 19,631 2023 Belgium Portugal France Norway Italy Discount rate 3.4 % 3.6 % 3.5 % 3.7 % 3.4 % Salary growth rate 0.0 % 2.0 % 2.5 % 0.8 % 3.0 % Pension growth rate 0.0 % 2.0 % 0.0 % 3.2 % 0.0 % 2022 Belgium Portugal France Norway Italy Discount rate 3.5 % 4.0 % 4.0 % 3.6 % 3.9 % Salary growth rate 0.0 % 2.0 % 2.5 % 0.7 % 3.0 % Pension growth rate 0.0 % 0.0 % 0.0 % 3.0 % 0.0 % The Group derives the discount rate used to determine the defined benefit obligation from yields on high quality corporate bonds of the duration corresponding to the liabilities.
As of 31 December 2023, the sensitivity of the defined benefit obligation to changes in the weighted principal assumptions were:
The pension plan assets allocation differs per plan. On a weighted average basis, the allocation was as follows:
2023 2022 Plan assets Fair value of
plan assets
in thousands of eurosFair value of
plan assets
in percentFair value of
plan assets
in thousands of eurosFair value of
plan assets
in percentEquity securities 5,399 23.3% 7,189 33.2% Debt securities 16,899 72.9% 13,362 61.7% Property 423 1.8% 401 1.9% Investment funds 392 1.7% 619 2.9% Cash 54 0.2% 102 0.5% Total 23,167 100% 21,673 100% As at 31 December 2023 Less than a year Between 1-2 year Between 2-5 year Between 5-10
yearTotal Pension benefits 1,952 2,015 5,489 14,164 23,620 The weighted average duration of the defined benefit obligation for retirement plans is 14 years at 31 December 2023.
In thousands of euros Restructuring Leases Jubilee Legal
claimsPlan Agents Others Total Changes in provisions As at 1 January 2023 267 1,971 1,559 1,642 819 1,450 7,708 Additional provisions charged to income statement 4,879 434 109 111 1 485 6,019 Used during the year (150) – (42) – (5) (383) (580) Unused amounts reversed (23) – (178) (219) – (91) (511) Acquisition of subsidiary – – – – – (87) (87) Reclassifications and other – – – 8 – (8) – Exchange differences (18) 2 – – – (69) (85) As at 31 December 2023 4,955 2,407 1,448 1,542 815 1,297 12,464 Composition of provisions Current 4,820 – – 20 – 329 5,169 Non Current 135 2,407 1,448 1,522 815 968 7,295 Total 4,955 2,407 1,448 1,542 815 1,297 12,464 The restructuring provision relates to employee termination benefits that have an uncertain character. The increase during the year is mostly related to employee termination benefits for leavers in various Euronext entities, with the main impact at Borsa Italiana Group.
The leases provision relates to estimated future dismantling or removing costs, primarily for the lease of its ‘Praetorium’ office in Paris.
The provision for Plan Agents relates to a retirement allowance for retired stockbrokers in Belgium, which is determined using actuarial assumptions. No cash outflows are expected for 2024.
The ‘Others’ provision primarily relates to a compensation scheme in Oslo, that gives employees compensation for a change in their historical DB pension arrangements.
(a) Amounts include salaries payable, bonus accruals, severance (signed contracts) and vacation accruals. The carrying values of current trade and other payables are reasonable approximations of their fair values. These balances do not bear interest.
Trade payables included an impact of €118.3 million (2022: €116.3 million) related to Nord Pool power purchases.
(a) Includes contract liabilities related to Indices licenses, software maintenance & hosting and corporate services The contract liabilities primarily relate to received consideration (or an amount of consideration is due) from customers for the initial (or subsequent) listing of equity securities, bond lifetime fees, indices licenses, software maintenance & hosting and corporate services. Contract liabilities are recognised as revenue when the Group performs under the contract.
The geographical information of the Group’s revenue from contracts with customers is disclosed in Note 8.1.1. Other geographical information is disclosed below.
In thousands of
eurosFrance Italy Netherlands United
KingdomBelgium Portugal Ireland United
StatesNorway Sweden Denmark Finland Germany Total 2023 Property, plant and equipment 8,224 36,528 12,971 1,055 226 11,758 17,236 678 23,887 8 1,501 – 301 114,373 Intangible assets other than Goodwill (a) 646 1,741,845 73,980 3,210 2 2,812 15,758 30,530 198,726 112 63,482 45 – 2,131,148 2022 Property, plant and equipment 8,068 26,702 19,551 376 238 9,723 17,928 921 24,551 – 1,331 – – 109,389 Intangible assets other than Goodwill (a) 1,174 1,772,795 61,647 4,512 4 3,779 17,452 34,287 223,302 303 63,579 132 – 2,182,966 As at 31 December 2023 In thousands of euros Amortised
costFVOCI
equity
instrumentsFVOCI
debt
instrumentsFVPL Total Financial assets CCP trading assets at fair value – – – 14,019,233 14,019,233 Assets under repurchase transactions 144,640,320 – – – 144,640,320 Other financial assets traded but not yet settled – – – 2,703,024 2,703,024 Debt instruments at fair value through OCI – – 116,286 – 116,286 Other instruments held at fair value – – – 119,746 119,746 Other receivables from clearing members 6,121,477 – – – 6,121,477 Cash and cash equivalents of clearing members 15,995,132 – – – 15,995,132 Total financial assets of the CCP clearing business 166,756,929 – 116,286 16,842,003 183,715,218 Financial assets at fair value through OCI – 262,655 – – 262,655 Financial assets at amortised cost 3,452 – – – 3,452 Trade and other receivables 303,515 – – – 303,515 Derivative financial instruments – – – – – Other current financial assets 32,907 – 70,146 – 103,053 Cash and cash equivalents 1,275,826 – – 172,962 1,448,788 Total 168,372,629 262,655 186,432 17,014,965 185,836,681 Financial liabilities CCP trading liabilities at fair value – – – 14,019,233 14,019,233 Liabilities under repurchase transactions 144,640,320 – – – 144,640,320 Other financial liabilities traded but not yet settled – – – 2,703,024 2,703,024 Other payables to clearing members 22,469,668 – – – 22,469,668 Total financial liabilities of the CCP clearing business 167,109,988 – – 16,722,257 183,832,245 Borrowings (non-current) 3,031,629 – – – 3,031,629 Borrowings (current) 17,286 – – – 17,286 Derivative financial instruments – – – 34 34 Other current financial liabilities – – – – – Trade and other payables 415,843 – – – 415,843 Total 170,574,746 – – 16,722,291 187,297,037 The nature and composition of the CCP clearing business assets and liabilities are explained in the accounting policies section in Note 3.
As at 31 December 2022 In thousands of euros Amortised
costFVOCI
equity
instrumentsFVOCI
debt
instrumentsFVPL Total Financial assets CCP trading assets at fair value – – – 7,486,731 7,486,731 Assets under repurchase transactions 134,172,307 – – – 134,172,307 Other financial assets traded but not yet settled – – – 8,296 8,296 Debt instruments at fair value through OCI – – 1,753,811 – 1,753,811 Other instruments held at fair value – – – 12,315 12,315 Other receivables from clearing members 9,795,350 – – – 9,795,350 Cash and cash equivalents of clearing members 13,613,729 – – – 13,613,729 Total financial assets of the CCP clearing business 157,581,386 – 1,753,811 7,507,342 166,842,539 Financial assets at fair value through OCI – 249,718 28,501 – 278,219 Financial assets at amortised cost 2,312 – – – 2,312 Trade and other receivables 318,087 – – – 318,087 Derivative financial instruments – – – – – Other current financial assets 67,242 – 95,498 – 162,740 Cash and cash equivalents (a) 894,923 – – 106,159 1,001,082 Total 158,863,950 249,718 1,877,810 7,613,501 168,604,979 Financial liabilities CCP trading liabilities at fair value – – – 7,486,731 7,486,731 Liabilities under repurchase transactions 134,172,307 – – – 134,172,307 Other financial liabilities traded but not yet settled – – – 8,296 8,296 Other payables to clearing members 25,191,350 – – – 25,191,350 Total financial liabilities of the CCP clearing business 159,363,657 – – 7,495,027 166,858,684 Borrowings (non-current) 3,027,161 – – – 3,027,161 Borrowings (current) 17,370 – – – 17,370 Derivative financial instruments – – – 19 19 Trade and other payables 396,287 – – – 396,287 Total 162,804,475 – – 7,495,046 170,299,521 (a) The portion of cash and cash equivalents held in Money Market Funds, which are correctly measured at fair value with gains and losses recognised through profit or loss as per 31 December 2022, have been onerously presented as amortised cost in the above table. As a result, this portion of cash and cash equivalents has been amended to be reflected in the correct column that agrees to the classification of such cash and cash equivalents. The Group’s exposure to various risks associated with the financial instruments is discussed in Note 37. The maximum exposure to credit risk at the end of the reporting period is the carrying amount of each class of financial assets mentioned above.
The table below analyses financial instrument carried at fair value, by valuation method. The different levels have been defined as follows:
In thousands of euros Level 1 Level 2 Level 3 Total As at 31 December 2023 Assets Financial assets at FVOCI Unlisted equity securities – – 262,655 262,655 Quoted debt instruments 70,146 – – 70,146 Quoted debt instruments of CCP clearing business 116,286 – – 116,286 Financial assets at FVPL Derivative instruments of CCP clearing business 14,019,233 – – 14,019,233 Other instruments of CCP clearing business 2,822,770 – – 2,822,770 Money market funds 172,962 – – 172,962 Total assets 17,201,397 – 262,655 17,464,052 Liabilities Financial liabilities at FVPL Derivative instruments of CCP clearing business 14,019,233 – – 14,019,233 Other instruments of CCP clearing business 2,703,024 – – 2,703,024 Other derivative instruments (a) – 34 – 34 Total liabilities 16,722,257 34 – 16,722,291 As at 31 December 2022 Assets Financial assets at FVOCI Unlisted equity securities – – 249,718 249,718 Quoted debt instruments 123,999 – – 123,999 Quoted debt instruments of CCP clearing business 1,753,811 – – 1,753,811 Financial assets at FVPL Derivative instruments of CCP clearing business 7,486,731 – – 7,486,731 Other instruments of CCP clearing business 20,611 – – 20,611 Money market funds (a) 106,159 – – 106,159 Total assets 9,491,311 – 249,718 9,741,029 Liabilities Financial liabilities at FVPL Derivative instruments of CCP clearing business 7,486,731 – – 7,486,731 Other instruments of CCP clearing business 8,296 – – 8,296 Other derivative instruments (b) – 19 – 19 Total liabilities 7,495,027 19 – 7,495,046 (a) The portion of cash and cash equivalents held in Money Market Funds, which are correctly measured at fair value with gains and losses recognised through profit or loss as per 31 December 2022, have been onerously presented as amortised cost in the above table. As a result, this portion of cash and cash equivalents has been amended to be reflected in the correct column that agrees to the classification of such cash and cash equivalents. (b) Including foreign exchange spot transactions of €19k in Nord Pool. The Group’s policy is to recognise transfers into and transfers out of fair value hierarchy levels at the end of the reporting period. There were no transfers between the levels of fair value hierarchy in 2023 and 2022. The Group did not measure any financial assets or financial liabilities at fair value on a non-recurring basis as at 31 December 2023.
35.2.2. Fair value measurements using quoted prices in active markets for identical assets or liabilities (level 1)
The quoted debt instruments primarily relate to investments in listed bonds held by Euronext Securities Copenhagen and Euronext Clearing’s own fund investments in government bonds.
The quoted debt instruments of CCP clearing business represent an investment portfolio in predominantly government bonds funded by the margins and default funds deposited by members of the CCP clearing business.
The derivative instruments of CCP clearing business comprise open transactions not settled at the reporting date on the derivatives market in which Euronext Clearing operates as a central counterparty. The other instruments of CCP clearing business include clearing member trading balances for equity and debt instruments that are marked to market on a daily basis.
Investments in funds are solely composed of money market funds which are redeemed within a three-month cycle after acquisition and have contractual cash flows that do not represent solely payments of principal and interest.
Fair values of the instruments mentioned above are determined by reference to published price quotations in an active market.
Foreign exchange spot transactions comprises agreements between two parties to buy one currency against selling another currency at an agreed price for settlement on the spot date. Fair value is based on the foreign exchange rates at the balance sheet date.
The following table presents the changes in level 3 instruments for the period ended 31 December 2023, which are recognised in the line item ‘Financial assets at fair value through other comprehensive income’ in the balance sheet. Revaluations are reflected in the line ‘Change in value of equity investments at fair value through other comprehensive income’ in the statement of comprehensive income:
In thousands of euros Unlisted equity
securitiesContingent
consideration
payablesRedemption
liabilityTotal As at 31 December 2021 207,693 – – 207,693 Revaluations recognised in OCI 42,054 – – 42,054 Revaluations recognised in P&L – – – – Additions / (disposals) – – – – Payments – – – – Acquisitions / (incurrences) – – – – Exchange differences and other (29) – – (29) As at 31 December 2022 249,718 – – 249,718 Revaluations recognised in OCI 11,865 – – 11,865 Revaluations recognised in P&L – – – – Additions / (disposals) 1,214 – – 1,214 Payments – – – – Acquisitions / (incurrences) – – – – Exchange differences and other (142) – – (142) As at 31 December 2023 262,655 – – 262,655 Concerning the valuation process for fair value measurement categorised within level 3 of the fair value hierarchy, the Group’s central treasury department collects and validates the available level 3 inputs and performs the valuation according to the Group’s valuation methodology for each reporting period. The fair value estimates are discussed with-, and challenged by the Group Finance Director and the Chief Financial Officer. Periodically the values of investments categorised in “level 3” are validated by staff with extensive knowledge of the industry in which the invested companies operate. Although valuation techniques are applied consistently as a principle, Management, upon advice from the Group’s valuation experts, may decide to replace a valuation technique if such a change would improve the quality or the reliability of the valuation process.
For measuring fair value of its long-term investments in unlisted equity securities in Euroclear S.A/N.V. and Sicovam Holding S.A., the Group applied a weighted approach, using both the Gordon Growth Model (with return on equity and expected dividend growth rate as key non-observable parameters) and recent observed market transactions taking into account an illiquidity discount for the limited number of transactions.
In 2023, the high interest rates environment led to a sharp increase of net interest earnings at Euroclear, which is predominantly driven by interests linked to frozen assets as a result of Russian sanctions and countermeasures.
The European Commission is contemplating various options to use the profits generated by sanctioned amounts held by financial institutions, including Euroclear, for the financing of Ukraine’s reconstruction.
Since considerable uncertainties persist, Euroclear considers it necessary to separate the estimated sanction-related earnings from the ‘underlying’ financial results when assessing the company’s performance and resources.
For this reason, the Group used the ‘underlying’ financial results published by Euroclear (i.e. excluding Russian-sanctions related assets/earnings), as an input for its primary valuation technique.
In addition, for measuring the fair value of Sicovam Holding S.A, the Group applied an illiquidity discount as an unobservable input for which a sensitivity impact of +10%/(-10%) would amount to a decrease or (increase) of €8.2 million in the fair value (2022: €8.2 million). More information on the investments is further disclosed in Note 20.
The key assumptions used in the Gordon Growth Model valuation model are shown in the tables below. The sensitivity analysis shows the impact on fair value using the most favorable combination (increase), or least favorable combination (decrease) of the unobservable inputs per investment in unlisted equity securities.
2023: In thousands of euros Fair value at 31
December 2023Unobservable inputs *) Range of inputs
(probability-weighted
average)Relationship of unobservable inputs
to fair valueIncrease decrease Euroclear S.A./N.V. 187,577 Return on equity
Expected dividend
growth rate9.7%-10.7% (10.2%)
1.0%-2.0%
(1.5%)5,668 (5,004) Sicovam Holding S.A. 73,483 Return on equity
Expected dividend
growth rate9.7%-10.7% (10.2%)
1.0%-2.0%
(1.5%)2,043 (2,107) *) There were no significant inter-relationships between unobservable inputs that materially affect fair value 2022: In thousands of euros Fair value at 31
December 2022Unobservable inputs *) Range of inputs
(probability-weighted
average)Relationship of unobservable inputs
to fair valueIncrease decrease Euroclear S.A./N.V. 175,888 Return on equity
Expected dividend
growth rate9.2%-10.2% (9.7%)
0.5%-1.5%
(1.0%)4,563 (5,039) Sicovam Holding S.A. 73,483 Return on equity
Expected dividend
growth rate9.2%-10.2% (9.7%)
0.5%-1.5%
(1.0%)1,775 (1,960) *) There were no significant inter-relationships between unobservable inputs that materially affect fair value The Group also has a number of financial instruments which are not measured at fair value in the balance sheet. For these instruments the fair values approximate their carrying amounts, except for non-current borrowings which fair value amounts to €2,683 million as per 31 December 2023 (2022: €2,446 million).
As per 31 December 2023, trade and other receivables included €76.9 million (2022: €70.3 million) of Nord Pool power sales positions and trade and other payables included €118.3 million (2022: €116.3 million) of Nord Pool power purchases positions.
For the year ended 31 December 2023, net treasury income through CCP clearing business is earned from instruments held at amortised cost or fair value as follows:
▪ A total €44.9 million gain was earned from financial assets and financial liabilities held at amortised cost (€778.4 million from interest income on liabilities held at amortised cost and €733.5 million from interest expenses on assets held at amortized cost). In 2022, a total €55.3 million gain was earned from financial assets and financial liabilities held at amortised cost (€28.6 million from interest income on liabilities held at amortised cost and €26.7 million from interest expenses on assets held at amortized cost). ▪ A net €1.7 million gain (2022: €11.3 million loss) was incurred from assets held at fair value (€6.6 million income and €4.9 million expense (2022: €32.3 million income and €43.6 million expense)). ▪ Furthermore in 2022, a revaluation loss of €48.9 million was incurred, following a one-off partial disposal of the debt investment portfolio held at Euronext Clearing. The Group recycled the related loss from Other Comprehensive Income to net treasury income. CCP clearing business financial assets and liabilities are offset and only the net amount is presented in the consolidated balance sheet when there is a legally enforceable right to offset the recognised amounts and there is an intention to settle on a net basis or to realise the asset and settle the liability simultaneously.
As at 31 December 2023 In thousands of euros Gross amounts Amount offset Net amount as
reportedDerivative financial asset 27,838,819 (13,819,586) 14,019,233 Reverse repurchase agreements 159,532,977 (14,892,657) 144,640,320 Other 5,824,758 (3,121,735) 2,703,023 Total assets 193,196,554 (31,833,978) 161,362,576 Derivative financial liabilities (27,838,819) 13,819,586 (14,019,233) Reverse repurchase agreements (159,532,977) 14,892,657 (144,640,320) Other (5,824,758) 3,121,735 (2,703,023) Total liabilities (193,196,554) 31,833,978 (161,362,576) As at 31 December 2022 In thousands of euros Gross amounts Amount offset Net amount as
reportedDerivative financial asset 22,371,041 (14,884,310) 7,486,731 Reverse repurchase agreements 145,460,677 (11,288,370) 134,172,307 Other 17,777 (9,481) 8,296 Total assets 167,849,495 (26,182,161) 141,667,334 Derivative financial liabilities (22,371,041) 14,884,310 (7,486,731) Reverse repurchase agreements (145,460,677) 11,288,370 (134,172,307) Other (17,777) 9,481 (8,296) Total liabilities (167,849,495) 26,182,161 (141,667,334) The Group has related party relationships with its associates and joint ventures (as described in Note 7). Transactions with associates and joint ventures are generally conducted with terms equivalent to arm’s length transactions. Transactions between subsidiaries are not included in the description as these are eliminated in the Consolidated Financial Statements. The interests in Group Companies are set out in Note 4.
Substantially all transactions with related parties and outstanding year-end balances reflect the positions with associate LCH SA and are reported in the tables below:
Therefore, as from the sale of the investment, the transactions with LCH SA do not qualify as “related party transactions” under IAS 24. Consequently the related party note reflects the transactions with LCH SA up to 6 July 2023.
The other related parties disclosure relates entirely to the key management of Euronext, being represented by the company’s Managing Board and Supervisory Board.
As a result of its operating and financing activities, the Group is exposed to market risks such as interest rate risk, currency risk and credit risk. The Group has implemented policies and procedures designed to measure, manage, monitor and report risk exposures, which are regularly reviewed by the appropriate management and supervisory bodies. The Group’s central treasury team is charged with identifying risk exposures and monitoring and managing such risks on a daily basis. To the extent necessary and permitted by local regulation, the Group’s subsidiaries centralise their cash investments, report their risks and hedge their exposures in coordination with the Group’s central treasury team. The Group performs sensitivity analyses to determine the effects that may result from market risk exposures. The Group uses derivative instruments solely to hedge financial risks related to its financial position or risks that are otherwise incurred in the normal course of its commercial activities. The Group does not use derivative instruments for speculative purposes.
The Group would be exposed to a liquidity risk in the case where its short-term liabilities become, at any date, higher than its cash, cash equivalents, short-term financial investments and available bank facilities and in the case where the Group is not able to refinance this liquidity deficit, for example, through new banking lines.
Cash, cash equivalents and short-term financial investments are managed as a global treasury portfolio invested in non-speculative financial instruments, readily convertible to cash, such as bank balances, money market funds, overnight deposits, term deposits and other money market instruments, thus ensuring a very high liquidity of the financial assets. The Group’s policy is to ensure that cash, cash equivalents and available bank facilities allow the Group to repay its financial liabilities at all maturities, even disregarding incoming cash flows generated by operational activities, excluding the related party loans granted by the Group’s subsidiaries to its Parent.
The net position of current financial assets, financial liabilities and available credit facilities, excluding working capital items, as of 31 December, 2023 and 2022 is described in the table below:
The Group has a €600 million revolving credit facility (2022: €600 million) that can be used for general corporate or M&A purposes (see Note 29). As of 31 December 2023, the Group did not have any amounts drawn under the facility.
The Group reviews its liquidity and debt positions on an ongoing basis, and subject to market conditions and strategic considerations, may from time to time re-examine the debt structure of its debt and modify the maturity profile and the sources of financing. The Group is able to support short term liquidity and operating needs through existing cash balance and its strong ability to generate adequate cash flow. The Group has generally access to debts markets, including bank facilities, and may be able to obtain additional debt or other sources of financing to finance its strategic development, provided that its financial risk profile allows it to do so.
The table below summarises the maturity profile of the Group’s financial liabilities based on contractual undiscounted payments, including principal - and interest amounts, expected throughout the life of the obligations:
In thousands of euros Maturity < 1
yearMaturity between 1
and 5 yearsMaturity > 5
yearsTotal 2023 Trade and other payables 415,843 – – 415,843 Borrowings 27,688 1,194,250 2,088,938 3,310,876 Lease liabilities 22,865 30,666 13,069 66,600 2022 Trade and other payables 396,287 – – 396,287 Borrowings 27,688 1,191,562 2,119,313 3,338,563 Lease liabilities (a) 28,786 20,208 2,163 51,157 (a) The figures for the comparative period were adjusted, as these were onerously reflecting ‘discounted’ lease liabilities, whereas ‘undiscounted’ lease liabilities should have been disclosed. The Group’s CCP must maintain a level of liquidity (consistent with regulatory requirements) to ensure the smooth operation of its respective markets and to maintain operations in the event of a single or multiple market stress event or member failure. This includes the potential requirement to liquidate the position of a clearing member under a default scenario including covering the associated losses and the settlement obligations of the defaulting member.
The Group’s CCP maintains sufficient cash and cash equivalents and has access to intraday central bank refinancing (collateralized with ECB eligible bonds) along with commercial bank credit lines to meet in a timely manner its payment obligations. As at 31 December 2023, the Group’s CCP had €440 million (2022: €420 million) credit lines granted by commercial banks serving as liquid recourse to mitigate liquidity risks according to EMIR regulation. None of the credit lines had been used as of 31 December 2023.
Revised regulations requires the CCP to ensure that appropriate levels of back-up liquidity are in place to underpin the dynamics of a largely secured cash investment requirement, ensuring that the maximum potential outflow under extreme market conditions is covered (see credit risk section). The Group’s CCP monitors its liquidity needs daily under normal and stressed market conditions. Where possible, the Group employs guaranteed delivery versus payment settlement techniques and manages CCP margin and default fund flows through central bank or long-established, bespoke commercial bank settlement mechanisms. Monies due from clearing members remain the clearing members’ liability if the payment agent is unable to effect the appropriate transfer. In addition, the Group’s CCP maintains operational facilities with commercial banks to manage intraday and overnight liquidity.
In line with the investment policy and the regulatory requirements, the Group’s CCP has deposited the default funds and margin mainly at the Central Bank of Italy as per 31 December 2023. As per 31 December 2022 the default funds and margin were partially invested in Government bonds with an average maturity of less than 12 months. Even though these financial assets are generally held to maturity, a forced liquidation of the investment portfolio could lead to losses and lack of required liquidity.
The table below analyses the Group’s CCP financial liabilities into relevant maturity groupings based on the remaining period from the balance sheet date to the contractual maturity date. The amounts disclosed in the table reflect the contractual undiscounted cash flows.
Substantially all interest-bearing financial assets and liabilities of the Group are either based on floating rates or based on fixed rates with an interest term of less than one year, except for the fixed rated Bonds #1 to #5, which have maturities between 5 and 20 years (see Note 29). Until 3 May 2022, the Group had entered into interest rate swap contracts in order to hedge the interest rate risk inherent to the fixed rate Bond #1. As a result, the Group was exposed to fair value risk affecting fixed-rate financial assets and liabilities through its remaining fixed rate Bonds #2 to #5. On 3 May 2022, the Group terminated its fixed-to-floating interest rate swap agreements (at an aggregated notional of €500 million) in relation to the fair value hedge of the €500 million Bond #1 (see Note 23).
Currency Position in EUR Positions in GBP Positions in USD Positions in NOK Positions in DKK Type of rate and maturity
In thousands of euroFloating
rate with
maturity <
1 yearFloating
rate with
maturity >
1 yearFloating
rate with
maturity <
1 yearFloating
rate with
maturity >
1 yearFloating
rate with
maturity <
1 yearFloating
rate with
maturity >
1 yearFloating
rate with
maturity <
1 yearFloating
rate with
maturity >
1 yearFloating
rate with
maturity <
1 yearFloating
rate with
maturity >
1 year2023 Interest bearing financial assets (a) 437,656 170 36,549 – 22,191 – 134,316 – 34,937 – Interest bearing financial liabilities – – – – – – – – – – Net position before hedging 437,656 170 36,549 – 22,191 – 134,316 – 34,937 – Net position after hedging 437,656 170 36,549 – 22,191 – 134,316 – 34,937 – 2022 Interest bearing financial assets (a) 620,734 216 44,557 – 23,749 – 100,312 – 40,540 – Interest bearing financial liabilities (8) – – – – – – – – – Net position before hedging – 216 44,557 – 23,749 – 100,312 – 40,540 – Net position after hedging 620,726 216 44,557 – 23,749 – 100,312 – 40,540 – Currency Position in EUR Positions in GBP Positions in USD Positions in NOK Positions in DKK Type of rate and maturity
In thousands of euroFixed rate
with
maturity <
1 yearFixed rate
with
maturity >
1 yearFixed rate
with
maturity <
1 yearFixed rate
with
maturity >
1 yearFixed rate
with
maturity <
1 yearFixed rate
with
maturity >
1 yearFixed rate
with
maturity <
1 yearFixed rate
with
maturity >
1 yearFixed rate
with
maturity <
1 yearFixed rate
with
maturity >
1 year2023 Interest bearing financial assets (a) 734,777 – 13,649 – 33,661 – 44,186 – 31,239 – Interest bearing financial liabilities 17,355 3,031,629 – – – – – – – – Net position before hedging 717,422 (3,031,629) 13,649 – 33,661 – 44,186 – 31,239 – Net position after hedging 717,422 (3,031,629) 13,649 – 33,661 – 44,186 – 31,239 – 2022 Interest bearing financial assets (a) 248,226 – 5,657 – 29,105 – 57,242 – 25,953 – Interest bearing financial liabilities 17,362 3,027,161 – – – – – – – – Net position before hedging 230,864 (3,027,161) 5,657 – 29,105 – 57,242 – 25,953 – Net position after hedging 230,864 (3,027,161) ) 5,657 – 29,105 – 57,242 – 25,953 – The Group was a net borrower in Euros exposed to fixed interest rates and a net lender in Euros exposed to floating rates at 31 December 2023 and 2022. Therefore, the sensitivity of net interest income to a parallel shift in the interest curves is that a 0.5% increase/decrease of the rate would have resulted in an increase/decrease of net interest income of €2.2 million based on the positions at 31 December 2023 (2022: €3.1 million).
The Group was a net lender in Pound Sterling at 31 December 2023 and 2022. The sensitivity of net interest income to a parallel shift in the interest curves is that a 0.5% increase/decrease of the rate would have resulted in an increase/decrease of net interest income of €0.2 million based on the positions at 31 December 2023 (2022: €0.2 million).
The Group was a net lender in US Dollar at 31 December 2023 and 2022. The sensitivity of net interest income to a parallel shift in the interest curves is that a 0.5% increase/decrease of the rate would have resulted in an increase/decrease of net interest income of €0.1 million based on the positions at 31 December 2023 (2022: €0.1 million).
The Group was a net lender in Norwegian Kroner at 31 December 2023 and 2022. The sensitivity of net interest income to a parallel shift in the interest curves is that a 0.5% increase/decrease of the rate would have resulted in an increase/decrease of net interest income of €0.5 million based on the positions at 31 December 2023 (2022: €0.5 million).
The fluctuation of the DKK against the EUR is set within the bandwidth +/-2.25% as an exchange rate mechanism established by the Denmark’s National Bank. Therefore, currency risk sensitivity inherent to the Group exposure to that currency is deemed to be irrelevant.
The Group’s CCP faces interest rate exposure through the impact of changes in the reference rates used to calculate member liabilities versus the yields achieved through their predominantly secured investment activities.
In the Group’s CCP, interest bearing assets are generally invested in secured instruments or structures and for a longer term than interest bearing liabilities, whose interest rate is reset daily. This makes investment revenue vulnerable to volatility in overnight rates and shifts in spreads between overnight and term rates. On daily basis the interest rate risk associated to investments is monitored via capital requirements.
The Group’s CCP has an investment policy, mitigating market risks. The Group’s CCP investments have an average duration of around one year and are generally held until maturity. Losses will not materialise unless the investment portfolio is liquidated before maturity or in an event of portfolio rebalancing before maturity. In case of a forced liquidation of the CCP’s financial investment portfolio before maturity to provide necessary liquidity, the CCP may face higher interest rate exposure on its financial investment portfolio. The interest rate exposure of the investment portfolio is predominantly at fixed rates (only a negligible part is at floating rates) at the amounts and maturities as disclosed in Note 37.1. As per 31 December 2023, an increase/decrease of the rate by 100 basis points would have an increasing/decreasing impact on the investment portfolio market value of €0.5 million or 0.20% (2022: €3.8 million or 0.20%).
The Group’s net assets are exposed to the foreign currency risk arising from the translation of assets and liabilities of subsidiaries with functional currencies other than the euro. The following table summarises the assets and liabilities recorded in respectively GBP, USD and NOK functional currency and the related impact of a 10% in/decrease in the currency exchange rate on balance sheet and profit or loss:
In thousands 2023 2022 Assets £ 89,586 £ 71,760 Liabilities £ (11,759) £ (12,465) Net currency position £ 77,827 £ 59,295 Net currency position after hedge £ 77,827 £ 59,295 Absolute impact on equity of 10% in/decrease in the currency exchange rate € 8,977 € 6,697 Absolute impact on profit for the period of 10% in/decrease in the currency exchange rate Not Material Not Material In thousands 2023 2022 Assets $ 198,636 $ 203,405 Liabilities $ (8,502) $ (11,231) Net currency position $ 190,134 $ 192,174 Absolute impact on equity of 10% in/decrease in the currency exchange rate € 17,224 € 17,952 Absolute impact on profit for the period of 10% in/decrease in the currency exchange rate € 520 € 921 In thousands 2023 2022 Assets kr 11,094,389 kr 10,753,715 Liabilities kr (2,527,631) kr (2,493,787) Net currency position kr 8,566,758 kr 8,259,928 Absolute impact on equity of 10% in/decrease in the currency exchange rate € 76,326 € 78,670 Absolute impact on profit for the period of 10% in/decrease in the currency exchange rate € 1,469 € 1,780 Most operating revenue and expenses in the various subsidiaries of the Group are denominated in the functional currency of each relevant subsidiary. The Group’s consolidated income statement is exposed to foreign currency risk arising from receivables and payables denominated in currencies different from the functional currency of the related entity.
The Group’s general policy is not to hedge foreign exchange risk related to its net investments in foreign currency. However, the Group may use derivatives instruments designated as hedge of net investment or foreign denominated debt to manage its net Investment exposures. The decision to hedge the exposure is considered on a case by case basis since the Group is generally exposed to major, well established and liquid currencies. The Group would, by the same token, hedge transaction risk arising from cash flows paid or received in a currency different from the functional currency of the group contracting entity on a case by case basis.
The Group’s investment in publicly traded equity securities was insignificant in 2023 and 2022. The Group’s investments in non-publicly traded equity securities are disclosed in Note 20.
The Group is exposed to credit risk in the event of a counterparty’s default. The Group is exposed to credit risk from its operating activities (primarily trade receivables), from its financing activities and from the investment of its cash and cash equivalents and short-term financial investments. The Group limits its exposure to credit risk by rigorously selecting the counterparties with which it executes agreements. Most customers of the Group are leading financial institutions that are highly rated. Investments of cash and cash equivalents in bank current accounts and money market instruments, such as short-term fixed and floating rate interest deposits, are governed by rules aimed at reducing credit risk: maturity of deposits strictly depends on credit ratings, counterparties’ credit ratings are permanently monitored and individual counterparty limits are reviewed on a regular basis. In addition to the intrinsic creditworthiness of counterparties, the Group’s policies also prescribe the diversification of counterparties (banks, financial institutions, funds) so as to avoid a concentration of risk. Derivatives are negotiated with leading high-grade bank.
In its role as CCP clearer to financial market participants, the Group’s CCP guarantees final settlement of transactions acting as buyer towards each seller and as seller towards each buyer. It manages substantial credit risks as part of its operations including unmatched risk positions that might arise from the default of a party to a cleared transaction.
Clearing membership selection is based upon supervisory capital, technical and organisational criteria. Each member must pay margins, computed and collected at least daily, to cover the exposures and theoretical costs which the CCP might incur in order to close out open positions in the event of the member’s default. Margins are calculated using established and internationally acknowledged risk models and are debited from participants’ accounts through central bank accounts and via commercial bank payment systems. Minimum levels of cash collateral are required. Non-cash collateral is revalued daily but the members retain title of the asset and the Group only has a claim on these assets in the event of a default by the member.
Clearing members also contribute to default funds managed by the CCP to guarantee the integrity of the markets in the event of multiple defaults in extreme market circumstances. Amounts are determined on the basis of the results of periodic stress testing examined by the risk committees of the CCP. Furthermore, the Group’s CCP reinforces its capital position to meet the most stringent relevant regulatory requirements applicable to it, including holding a minimum amount of dedicated own resources to further underpin the protective credit risk framework in the event of a significant market stress event or participant failure.
An analysis of the aggregate clearing member contributions of margin and default funds across the CCP is shown below:
In thousands of euros 31 December
202331 December
2022Total collateral pledged Margin received in cash 15,381,233 17,777,769 Margin received by title transfer 987,595 625,779 Default fund total 5,154,917 5,909,844 Total on balance sheet collateral (a) 21,523,745 24,313,392 Total member collateral pledged 21,523,745 24,313,392 (a) The counterbalance of the total on balance sheet collateral is included in the line ‘other payables to clearing members’ in the table at Note 35.1 Investment counterparty risk for CCP margin and default funds is managed by investing the cash element in instruments or structures deemed ‘secure’, including through direct investments in highly rated, ‘regulatory qualifying’ sovereign bonds and supra-national debt, investments in tri-party and bilateral reverse repos (receiving high-quality government securities as collateral) in certain jurisdictions and deposits with the central bank of Italy. As per December 2023 the margin and default funds were mainly deposited with the Central Bank of Italy. The small proportion of cash that is invested unsecured is placed for short durations with highly rated counterparties where strict limits are applied with respect to credit quality, concentration and tenor.
In thousands of euros 31 December
202331 December
2022Investment portfolio 116,286 1,753,811 CCP other financial assets (a) 116,286 1,753,811 Clearing member cash equivalents - short term deposits 10,084 10,011 Clearing member cash - central bank deposits 15,983,047 13,601,918 Clearing member cash - other banks 2,001 1,800 Total clearing member cash (b) 15,995,132 13,613,729 (a) The CCP other financial assets are included in the line ‘Debt instruments at fair value through other comprehensive income’ in the table at Note 35.1. (b) The total clearing member cash is included in the line ‘Cash and cash equivalents of clearing members” in the table at Note 35.1. Distress can result from the risk that certain governments may be unable or find it difficult to service their debts. This could have adverse effects, particularly on the Group’s CCP, potentially impacting cleared products, margin collateral, investments, the clearing membership and the financial industry as a whole.
Specific risk frameworks manage country risk for both fixed income clearing and margin collateral and all clearing members’ portfolios are monitored regularly against a suite of sovereign stress scenarios. Investment limits and counterparty and clearing membership monitoring are sensitive to changes in ratings and other financial market indicators, to ensure the Group’s CCP is able to measure, monitor and mitigate exposures to sovereign risk and respond quickly to anticipated changes. Risk Committees maintain an ongoing watch over these risks and the associated policy frameworks to protect the Group against potentially severe volatility in the sovereign debt markets. The Group’s sovereign exposures at the end of the financial reporting period were:
(a) ‘EU Central’ consists of supra-national debts. (b) The total sovereign investments include the investment portfolio of CCP clearing business assets as disclosed in the line ‘Debt instruments at fair value through other comprehensive income’ in the table at Note 35.1. The Group’s trade and contract receivables and other debt financial assets at amortised cost or FVOCI (including CCP clearing business) are subject to the expected credit loss model. While cash and cash equivalents are also subject to the impairment requirements of IFRS 9, the identified impairment loss was considered immaterial.
The Group applies the IFRS 9 simplified approach to measuring expected credit losses which uses a lifetime expected loss allowance for all trade and contract receivables.
To measure expected credit losses, trade and contract receivables have been grouped based on shared credit risk characteristics and the days past due. The historical loss rates are based on the payment profiles of the sales over a period of 24 months before reporting date and the corresponding historical credit losses experience within this period. The historical loss rates are adjusted to reflect current and forward-looking factors specific to the debtors and economic environment. Generally trade receivables are written-off when there is no reasonable expectation of recovery. The maximum exposure to credit risk at the reporting date is the carrying value of each class of financial assets disclosed in Note 21. The Group evaluates the concentration of credit risk with respect to trade and contract receivables as low, as most of its customers are leading financial institutions that are highly rated.
Set out below is the information about the credit risk exposure on the Group’s trade and contract receivables using a provision matrix as at 31 December 2023 and 2022:
Trade receivables In thousands of euros Contract
ReceivablesCurrent 30-60
days past
due61-90
days past
due> 91
days past
dueTotal Expected credit loss rate 0.06 % 0.06 % 0.23 % 0.50 % 1.32 % Collectively assessed receivables 29,100 185,707 36,154 12,249 20,825 284,035 Expected credit loss collective basis 17 107 84 62 275 545 Expected credit loss rate – – – – 100.0 % Individually assessed receivables – – – – 8,040 8,040 Expected credit loss individual basis – – – – 8,040 8,040 Total expected credit loss 17 107 84 62 8,315 8,585 Trade receivables In thousands of euros Contract
ReceivablesCurrent 30-60
days past
due61-90
days past
due> 91
days past
dueTotal Expected credit loss rate 0.07 % 0.07 % 0.28 % 0.67 % 1.78 % Collectively assessed receivables 32,096 175,477 35,980 14,215 39,853 297,621 Expected credit loss collective basis 21 115 102 96 710 1,044 Expected credit loss rate – – – – 100.0 % Individually assessed receivables – – – – 6,304 6,304 Expected credit loss individual basis – – – – 6,304 6,304 Total expected credit loss 21 115 102 96 7,014 7,348 In 2023, the increase in loss allowance provision for individually assessed receivables related to an increase of specific debtors, which showed a significant increase in credit risk. This increase is partly offset by a decrease of the loss allowance provision for collectively assessed receivables, which was due to a lower customer base in the highest category of days outstanding and a mathematical reduction in historical loss rates (caused by a decrease in historical credit losses).
The other debt financial assets comprise i) debt investments at amortised cost, which include short-term deposits with a maturity over three months, ii) debt investments at FVOCI, which include investments in listed bonds and government bonds and iii) CCP clearing business financial assets at amortised cost or FVOCI.
The other debt financial assets at amortised cost or FVOCI (including CCP clearing business) are considered to have low credit risk, as the issuers of the instruments have a low risk of default evidenced by their strong capacity to meet their contractual cash flow obligations in the near term. The Group closely monitors its CCP investment portfolio and invests only in government debt and other collateralised instruments where the risk of loss is minimal. There was no increase in credit risk in the year and none of the assets are past due. The loss allowance recognised during the period was therefore limited to 12 months expected credit losses. The Group did not recognise any material provision for expected credit losses on its other debt financial assets at amortised cost or FVOCI (including CCP clearing business) as per 31 December 2023 (2022: not material). The amount of credit-impaired financial assets is considered not significant.
The Group’s objectives when managing capital are to safeguard the Group’s ability to continue as a going concern, to comply with regulatory requirements and to maintain an optimal capital structure to reduce the cost of capital and provide return to shareholders. Certain entities of the Group are regulated as Exchanges, as Central Securities Depository (CSD) or as Clearing House and are subject to certain statutory regulatory requirements based on their local statutory financial statements and risks. In general, the financial ratios of the Group’s subsidiaries significantly exceed the regulatory requirements and they maintain a safety cushion in order to avoid any concern from the regulators.
Euronext N.V. must comply with prudential requirements, as a result of an agreement reached with the Dutch Finance Ministry in May 2016, which are set forth in three pillars:
■ A minimum Total Equity level equal of at least € 250 million; and ■ The Group shall take care of stable financing. Long-term assets of the Group will be financed with shareholders equity and long term liabilities, to the satisfaction of the AFM; and ■ The Group shall have a positive regulatory capital on a consolidated basis. The regulatory capital is calculated according to the following formula: the paid up share capital plus the freely available reserves less the items listed in section 36 of Regulation (EU) no. 575/201. In deviation to mentioned formula, the value of the intangible fixed assets in connection with Mergers and Acquisitions will be deducted in 10 (default) or more (20 for Oslo Børs ASA) equal instalments (grow in period) from the regulatory capital. Considering a consistent dividend policy, the grow in period can be extended if the P/E ratio would exceed 10 times. If the grow in period and the related dividend policy provide for a negative a regulatory capital for a limited number of years of the gown-in period, then this fact will not prevent the execution of the consistent and prudent dividend policy of the Group in those years. Euronext Amsterdam N.V. is subject to a minimum statutory capital requirement of €730 thousand, shall have a regulatory capital in the amount of 50% of the direct fixed cost of Euronext Amsterdam N.V. during the preceding financial year and in addition the cash and cash equivalents shall be higher than the required minimum regulatory capital to operate as an exchange in the Netherlands. As per 31 December 2023, Euronext Amsterdam N.V. was in compliance with these requirements.
Euronext Brussels SA/NV shall maintain adequate financial resources at its disposal to ensure orderly functioning of the market. The law mentions that FSMA may, by a regulation, set financial ratios for market operators and determine which financial information they are required to provide. At this date, no quantitative requirements has ever been set either by a regulation or by the Financial Authority FSMA.
Euronext Dublin shall at all time hold a minimum level of capital based on the Basic Capital Requirement and the Systematic Capital Add-on and maintain liquid financial assets at least equal to the sum of these two amounts of required capital. As per 31 December 2023, Euronext Dublin complied with these requirements.
Euronext Lisbon S.A. shall maintain minimum statutory share capital of €3.0 million and shall maintain minimum statutory equity of €6.0 million. In addition, Euronext Lisbon’s liabilities must not exceed its own funds (basically the amount of equity). As per 31 December 2023, Euronext Lisbon complied with these requirements.
Euronext Paris S.A. shall maintain statutory regulatory equity at no less than 50% of its yearly expenses and a solvency ratio on operational risks at no less than 8%. As per 31 December 2023, Euronext Paris S.A. complied with these requirements.
Interbolsa S.A. shall maintain minimum statutory share capital of €2.75 million and shall maintain minimum statutory equity of €5.5 million. In addition, as a CSD, Interbolsa S.A. shall hold an amount of capital, including retained earnings and reserves, higher or equal to the sum of CSD’S capital requirements. As per 31 December 2023, Interbolsa S.A. complied with these requirements.
VPS ASA shall comply with the capital requirement regulation for CSDs. As such, it shall hold an amount of capital, including retained earnings and reserves, higher or equal to the sum of CSD’s capital requirements. As per 31 December 2023, VPS ASA complied with this requirement.
Oslo Børs ASA must maintain an adequate level of primary capital. In this context, primary capital comprises equity after deducting items including intangible assets such as system development costs and deferred tax assets. Although the Norwegian legislation does not stipulate any specific quantitative level of capital requirements, Oslo Børs ASA maintains at all times sufficient liquid assets and capital resources. As per 31 December 2023, Oslo Børs ASA complied with these requirements.
Euronext Markets Singapore Pte Ltd. shall maintain a minimum regulatory capital requirement (a) 18% of its annual operating revenue, (b) 50% of its annual operating costs, and (c) $500,000 restricted cash deposit. As per 31 December 2023, Euronext Markets Singapore Pte Ltd. complied with these requirements.
VP Securities AS shall comply with the capital requirement regulation for CSDs. As such, it shall hold an amount of capital, including retained earnings and reserves, higher or equal to the sum of CSD’s capital requirements. As per 31 December 2023, VP Securities AS complied with this requirement.
Borsa Italiana S.p.A must comply with Article 3 of the Italian CONSOB Markets Regulation. As such, it shall maintain 1) a net equity (share capital, reserves and undistributed profits) at least equal to operating costs necessary to cover six months based on the latest audited Financial statements and 2) an amount of liquid assets sufficient to cover estimated potential losses in stressed but plausible market conditions calculated using a risk-based approach which considers operational risks as well as other risks to which the regulated operator might be exposed to. As per 31 December 2023 Borsa Italiana S.p.A. complied with these requirements.
Monte Titoli S.p.A. shall comply with article 47 of the CSDR regulation. As such, it shall hold capital (inclusive of undistributed profits and “Total Capital Requirement” reserves) which, at any time, is sufficient to guarantee that the CSD is adequately protected against operational, legal, custody, investment and commercial risks, so that it may continue to provide services; ensure a liquidation or an orderly restructuring of the activities of the CSD in an adequate period of at least 6 months, in the context of a series of stress scenarios. The capital thus identified must be invested in secured assets in order to comply with the provisions of Article 46 paragraph 4 of the CSDR Regulation. As per 31 December 2023, Monte Titoli S.p.A. complied with this requirement.
Cassa di Compensazione e Garanzia S.p.A. must comply with Article 2 of EMIR based on which it must have capital (including undistributed profits and reserves) which at all times is sufficient to cover the total exposure to the following risks:
The capital thus identified must be invested in secured assets for the purpose of complying with Article 47 of EMIR. As per 31 December 2023, Cassa di Compensazione e Garanzia S.p.A. complied with these requirements.
MTS S.p.A. must comply with Article 3 of the Italian CONSOB Markets Regulation. As such, it shall maintain 1) a net equity (share capital, reserves and undistributed profits) at least equal to operating costs necessary to cover six months based on the latest audited Financial statements and 2) an amount of liquid assets sufficient to cover estimated potential losses in stressed but plausible market conditions calculated using a risk-based approach which considers operational risks as well as other risks to which the regulated operator might be exposed to. As per 31 December 2023, MTS S.p.A. complied with these requirements.
The changes in liabilities arising from the Group’s financing activities in 2023 and 2022 were as follows:
In thousands of euros Borrowings due
within 1 yearBorrowings due
after 1 yearLeases due within
1 yearLeases due after 1
yearTotal liabilities
from financing
activityAs at 1 January 2022 17,359 3,044,391 20,993 50,691 3,133,434 Cash flows (29,565) – (23,417) – (52,982) Acquisitions – – – – – Additions (a) – – – 1,904 1,904 Fair Value adjustments – (19,091) – – (19,091) Accrued interest 29,576 – 733 – 30,309 Amortisation and transfer of issue costs – 1,861 – – 1,861 Foreign exchange impacts – – (87) 29 (58) Other (a) – – 30,244 (30,976) (732) As at 31 December 2022 17,370 3,027,161 28,466 21,648 3,094,645 Cash flows (28,711) – (28,423) – (57,134) Acquisitions – – – – – Additions – – – 37,924 37,924 Fair Value adjustments – 2,592 – – 2,592 Accrued interest 28,627 – 1,085 – 29,712 Amortisation and transfer of issue costs – 1,876 – – 1,876 Foreign exchange impacts – – (64) (77) (141) Other – – 21,095 (22,181) (1,086) As at 31 December 2023 17,286 3,031,629 22,159 37,314 3,108,388 (a) For the lines ‘Additions’ and ‘Other’ the figures in the comparative period were adjusted, as the additions should all have been reflected in leases due after 1 year. The line ‘Other’ was adjusted in accordance as this line embeds the effect of reclassification of non-current portion of lease liabilities to current due to the passage of time. The line ‘Other’ includes the effect of reclassification of non-current portion of lease liabilities to current due to the passage of time.
The Group is involved in a number of legal proceedings or activities in the ordinary course of our business where risks have arisen which are not reflected in whole or in part in the consolidated financial statements. Other than as discussed below, management does not expect these pending or threatening legal proceedings to have a significant effect on the Group’s financial position or profitability. The outcome of legal proceedings, however, can be extremely difficult to predict and the final outcome may be materially different from managements’ expectation.
In the court case between Euronext Amsterdam and approximately 120 retired and/or former Euronext Amsterdam employees, united in an association (“VPGE”), the Higher Court ordered Euronext to restore the pension reduction to the VPGE members and to pay for indexation of the VPGE member’s pensions on 28 July 2020. Euronext lodged an appeal in Cassation before the Supreme Court on 23 October 2020.
On 29 October 2021, the Attorney General (“Advocaat-Generaal”) advised the Supreme Court to annul the decision of the Higher Court and to reject the cross-appeal filed by VPGE. On 23 September 2022, the Supreme Court has overturned the verdict of the Higher Court. The Supreme Court agreed with Euronext’s position on all points raised.
In accordance with Dutch procedural rules, the case will now be reverted back to the Higher Court that has to take the final decision, taking into account the verdict of the Supreme Court. The final verdict is expected in May 2024.
As per 31 December 2023, Euronext N.V. participates in a number of guarantees within the Group (see Note 59).
In Portugal, Norway, Denmark and Italy, the Group acts as a National Central Securities Depository, operated by respectively Euronext Securities Lisbon (Interbolsa), Euronext Securities Oslo (Verdipapirsentralen ASA), Euronext Securities Copenhagen (VP Securities AS) and Euronext Securities Milan (Monte Titoli S.p.A.).
As at 31 December 2023, the value of securities kept in custody by Euronext Securities Lisbon amounted to €388 billion (2022: €386 billion) based on the market value of shares and the nominal value of bonds. The procedures of this National Central Securities Depository are focused on the provision of notary services, central maintenance services and settlement securities services, according to the CSDR (Central Securities Depository Regulation). The settlement services, provided through T2S platform, have its risks mitigated mainly by early warning systems. The reconciliation procedures in place mitigate the major risks related to the registration of securities.
As at 31 December 2023, the value of securities kept in custody by Euronext Securities Oslo amounted to €746 billion (2022: €744 billion) based on the market value of shares and the nominal value of bonds.
Under the terms of Section 9-1 the Norwegian Central Securities Depository Act of 15 March 2019, Euronext Securities Oslo is liable for losses that other parties may incur as a result of errors that occur in connection with registration activities. This does not apply if Euronext Securities Oslo is able to demonstrate that the error was outside Euronext Securities Oslo’s control. The statutory liability according to Section 9-1, first Paragraph, only applies to direct losses and is limited to NOK 500 million for the same error. For losses that can be attributed to an account operator, Euronext Securities Oslo is jointly and severally liable with the account operator for NOK 50 million per error. Above this amount, the central securities depository is not liable for losses that can be attributed to an account operator.
Euronext Nordics Holding AS has taken out errors and omissions insurance for the parent company and its subsidiaries, with an annual limit of NOK 967 million and a deductible of NOK 10 million per claim. Euronext Securities Oslo shares this insurance with the other companies in the Group up to a limit of NOK 300 million and is the sole insured party for the balance of NOK 667 million. The insurance is subject to a limit of NOK 500 million for any one claim.
As at 31 December 2023, the value of securities kept in custody by Euronext Securities Copenhagen amounted to €1,586 billion (2022:€1,443 billion) based on the market value of shares and the nominal value of bonds. The procedures of this National Central Securities Depository are focused on the provision of notary services, central maintenance services and settlement securities services, according to the CSDR (Central Securities Depository Regulation). The settlement services, provided through T2S platform, have its risks mitigated mainly by early warning systems. The reconciliation procedures in place mitigate the major risks related to the registration of securities.
As at 31 December 2023, the value of securities kept in custody by Euronext Securities Milan amounted to €3,863 billion (2022:€3,730 billion) based on the market value of shares and the nominal value of bonds. The procedures of this National Central Securities Depository are focused on the provision of notary services, central maintenance services and settlement securities services, according to the CSDR (Central Securities Depository Regulation). The settlement services, provided through T2S platform, have its risks mitigated mainly by early warning systems. The reconciliation procedures in place mitigate the major risks related to the registration of securities.
The significant events that occurred between 31 December 2023 and the date of this report that could have a material impact on the economic decisions made based on these financial statements are listed below:
On 3 January 2024, the Group announced that it has completed the share repurchase programme announced on 27 July 2023. Between 31 July 2023 and 3 January 2024, 2,870,787 shares, or approximately 2.7% of Euronext’s share capital, were repurchased at an average price of €69.67 per share. This repurchase programme was executed by a financial intermediary in compliance with applicable rules and regulations, including the Market Abuse Regulation 596/2014 and the Commission Delegated Regulation (EU) 2016/1052, and based on the authority granted by the General Meeting of Shareholders 280991 of Euronext on 17 May 2023.
Amsterdam, 28 March 2024
Supervisory Board
Piero Novelli (Chair)
Dick Sluimers
Diana Chan
Rika Coppens
Alessandra Ferone
Manuel Ferreira da Silva
Padraic O’Connor
Nathalie Rachou
Olivier Sichel
Morten Thorsrud
Managing Board
Stéphane Boujnah (CEO and Chairman)
Daryl Byrne
Delphine d’Amarzit
Fabrizio Testa
Isabel Ucha
Øivind Amundsen
Simone Huis in ’t Veld
Benoît van den Hove
Manuel Bento
Year ended In thousands of euros Note 31 December 2023 31 December 2022 Net turnover 42 – – Other operating expenses 43 (13,852) (15,029) Total operating (loss) (13,852) (15,029) Income from equity investments 44 12,146 9,306 Other interest income and similar income 44 33,191 18,592 Other interest expenses and similar charges 44 (79,724) (47,862) Gain on sale of associates 45 53,028 – Result before tax 4,789 (34,993) Tax 46 12,794 5,406 Share in result of participations 47 495,984 467,414 Net result for the year 513,567 437,827 In thousands of euros Note As at 31
December 2023As at 31
December 2022Assets Fixed assets Investments in consolidated subsidiaries 47 6,197,563 6,237,933 Investments in associates and joint ventures 47 – 70,562 Related party loans 47 460,024 459,408 Financial assets at fair value through OCI 48 178,734 166,349 Other non-current financial and other assets 49 714 1,013 Total financial fixed assets 6,837,035 6,935,265 Total fixed assets 6,837,035 6,935,265 Current assets Trade and other receivables 50 215,279 250,635 Income tax receivable 31,508 32,383 Related party loans 51 155,105 155,754 Total receivables 401,892 438,772 Other current financial assets – 10,000 Total securities 52 – 10,000 Cash and cash equivalents 52 429,836 258,464 Total current assets 831,728 707,236 Total assets 7,668,763 7,642,501 Shareholders’ equity and liabilities Shareholders’ equity Issued capital 171,370 171,370 Share premium 2,423,428 2,423,428 Reserve for own shares (242,117) (32,836) Retained earnings 1,014,805 820,358 Legal reserves and other 64,638 93,820 Profit for the year 513,567 437,827 Total shareholders’ equity 53 3,945,691 3,913,967 Long-term liabilities Borrowings 54 3,031,629 3,027,161 Deferred tax liabilities 20,894 19,202 Provisions 150 – Total long-term liabilities 3,052,673 3,046,363 Short-term liabilities Borrowings 54 17,286 17,362 Related party borrowings 55 242,679 241,007 Trade and other payables 56 410,434 423,802 Total short-term liabilities 670,399 682,171 Total shareholders’ equity and liabilities 7,668,763 7,642,501 Euronext N.V. is a Dutch public company with limited liability (naamloze vennootschap) which has its registered office in Amsterdam under Chamber of Commerce number 60234520.
The company financial statements of Euronext N.V. (hereafter: the Company) have been prepared in accordance with Part 9, Book 2 of the Dutch Civil Code. In accordance with sub 8 of article 362, Book 2 of the Dutch Civil Code, the company’s financial statements are prepared based on the accounting principles of recognition, measurement and determination of profit, as applied in the consolidated financial statements. These principles also include the classification and presentation of financial instruments, being equity instruments or financial liabilities.
In case no other policies are mentioned, refer to the accounting policies as described in the accounting policies in the Consolidated Financial Statements of this Annual report. For an appropriate interpretation, the Company Financial Statements of Euronext N.V. should be read in conjunction with the Consolidated Financial Statements.
Investments in consolidated subsidiaries are presented at net asset value. Net asset value is based on the measurement of assets, provisions and liabilities and determination of profit based on the principles applied in the consolidated financial statements.
If the valuation of a consolidated subsidiary based on the net asset value is negative, it will be stated at nil. If and insofar the Company can be held fully or partially liable for the debts of the consolidated subsidiary, or has the firm intention of enabling the consolidated subsidiary to settle its debts, a provision is recognised for this. In determining the value of consolidated subsidiaries with a negative equity, any non-current loans, issued to the consolidated subsidiary, that should be seen as part of the net investment are taken into account.
Non-current loans are considered to be part of the net investment if these loans are not expected to be settled in the near future nor planned to be settled in the near future.
Euronext N.V. receives market data revenues. The subsidiaries charge Euronext N.V. as market data providers. Euronext N.V. does not charge its subsidiaries a fee for its role of administering the sale of market data to third parties and as such does not recognise a margin on the sales.
In 2023, Professional services included €3.6 million (2022: €1.2 million) of acquisition costs that mainly related to contemplated acquisitions that would increase the perimeter of the Group. Other expenses included €3.1 million of intercompany service recharges (2022: €8.7 million).
Euronext N.V. had no employees during 2023 and 2022. The remuneration of the Supervisory Board is included in other expenses.
In 2023 and 2022, income from equity investments contains the dividend received from Euroclear S.A./ N.V.
The recent evolution of ascending interest rates resulted in an increase of interest and similar income, which is primarily incurred on the Company’s outstanding cash balances. The interest rates in the comparative period were at significantly lower levels.
Interest and similar income further includes the interest income on related party loans for €21.5 million in 2023 (2022: €16.6 million).
Interest and similar expenses increased following the evolution of ascending interest rates during the year and includes the interest expenses on related party borrowings and cash pool positions with subsidiaries for in total €22.9 million in 2023 (2022: €3.1 million).
Interest and similar expenses further includes the full year impact of interest expenses on the Senior Unsecured Notes that are held by the Company.
In 2023 and 2022, the exchange differences are mainly triggered by revaluations of the related party loans to Euronext Nordics Holding AS, Euronext UK Holdings Ltd., and Euronext US Inc.
On 6 July 2023, the Group sold its 11.1% investment in associate LCH SA to LCH Group Ltd for consideration of €111.0 million. The investment was held at a carrying amount of €69.4 million, resulting in a gain on disposal of €41.6 million.
On 30 November 2023, the Group sold its 18.93% investment in associate Tokeny S.a.r.l. for an amount of €11.4 million. As the investment was held at a carrying amount of zero million, the full proceeds of the sale were recognised in gain on disposal of associates.
The effective tax rate mainly deviates from the applicable tax rate as a result exempt capital gains realized on the sale of LCH SA and Tokeny SarL shares.
For the year 2023, the statutory corporate income tax rate was 25.8%, which will remain stable for 2024. Reference is made to Notes 15 and 19 of the Consolidated Financial Statements for more information on the tax rate changes.
Note 47. Investments in consolidated subsidiaries, associates, joint ventures and non-current related party loans
In thousands of euros Investments in
consolidated
subsidiariesInvestments in
associates and
joint venturesRelated party
loansTotal Net book amount as at 1 January 2022 6,419,938 68,476 469,869 6,958,283 Investments / (disposals) (3,282) – – (3,282) Capital contributions / (settlements) 21,557 – – 21,557 Exchange differences (26,173) – (10,461) (36,634) Share-based payments, subsidiaries 13,994 – – 13,994 Actuarial gains/ losses IAS 19 10,567 – – 10,567 Revaluation financial assets at FVOCI 20,352 – – 20,352 Share in result of participations 458,677 8,737 – 467,414 Dividend received (662,827) (6,651) – (669,478) Reclassification – – – – Other (14,870) – – (14,870) Total movements in book value (182,005) 2,086 (10,461) (190,380) Net book amount as at 31 December 2022 6,237,933 70,562 459,408 6,767,903 Investments / (disposals) 10 (69,415) 25,000 (44,405) Capital contributions / (settlements) – – – – Exchange differences (50,588) – (24,384) (74,972) Share-based payments, subsidiaries 14,378 – – 14,378 Actuarial gains/ losses IAS 19 (1,176) – – (1,176) Revaluation financial assets at FVOCI 5,654 – – 5,654 Share in result of participations 489,372 6,612 – 495,984 Dividend received (485,631) (7,759) – (493,390) Reclassification – – – – Other (12,389) – – (12,389) Total movements in book value (40,370) (70,562) 616 (110,316) Net book amount as at 31 December 2023 6,197,563 – 460,024 6,657,587 In 2023, no significant investments or capital contributions occurred. In 2022, Euronext N.V. made a capital contribution in Euronext Paris S.A. of €21.6 million.
The line ‘Other’ includes the cost of employee shares vesting in the subsidiaries for a total of €11.5 million in 2023 (2022: €15.8 million).
In 2023, the Company sold its investments in associates LCH SA and Tokeny Sarl at proceeds of €111.0 million and €11.4 million respectively. The investments were disposed at a carrying amount of €69.4 million, resulting in a gain on sale of associates of €53.0 million (See Notes 7 and 14 of the Consolidated Financial Statements).
In 2022, the investment in joint venture Liquidshare was impaired by €1.5 million, which negatively impacted ‘share in result of participation’ (see Note 7 of the Consolidated Financial Statements).
In 2022, Euronext N.V. entered into a loan agreement with Euronext Holding Italia S.p.A. at a principal amount of €200.0 million, with no outstanding amount at end of last year. As per 31 December 2023, €25.0 million was outstanding and is reflected as ‘investments’. This loan has a maturity of three years and bears an interest rate of EURIBOR plus 0.135%.
Euronext N.V. has a loan agreement of NOK 3,500 million entered into with Euronext Nordics Holding AS, to partially finance the acquisition of the share capital and voting rights of Oslo Børs VPS Holding ASA in 2019. This loan has a maturity of five years (to be extended with five years), with a fixed interest rate of 3%.
Furthermore, Euronext N.V. has a loan agreement of £16.3 million entered into with Euronext UK Holdings Ltd. to enable the acquisition of Commcise Software Ltd. in 2018. This loan has a maturity of ten years and bears an interest rate of SONIA plus 0.125%.
In addition, Euronext N.V. has granted three loan agreements to Euronext US Inc. for a total amount of $115.3 million, of which $110.0 million was granted in order to finance the acquisition of FastMatch Inc. in 2017. These loans have a maturity of ten years and bear a weighted average interest rate of 3.36%.
The interest amounts of the above mentioned loans are recognised monthly and are included in Note 51. The long-term loans in foreign currencies are not expected, nor planned, to be settled in the near future. Therefore, these loans are regarded as part of the net investment in the foreign operation.
As at 31 December 2023, the total outstanding amount of non-current related party loans are €460.0 million (2022: €459.4 million).
The financial assets at fair value through Other Comprehensive Income of €178.7 million (2022: €166.3 million) represent the direct investments of €177.4 million in Euroclear S.A./N.V. and €1.3 million in EuroCTP B.V. (which was acquired in 2023). For additional information on this investment, reference is made to Note 20 of the Consolidated Financial Statements.
As per 31 December 2023 the €0.7 million (2022: €1.0 million) of Other non-current financial and other assets includes the issue costs linked to the revolving credit facility.
In thousands of euros As at 31
December
2023As at 31
December
2022Trade receivables 24,794 14,235 Contract receivables 17,164 11,290 Allowance for expected credit losses (33) (17) Trade and contract receivables net 41,925 25,508 Related party receivables 166,725 220,311 Tax receivables (excluding income tax) 1,987 1,954 Prepayments and accrued income 474 232 Other receivables 4,168 2,630 Total 215,279 250,635 Trade receivables are non-interest bearing and generally on terms of 30 to 90 days. Contract receivables represent amounts in respect of unbilled revenue, for which the Group has an unconditional right to the consideration (i.e. only the passage of time is required before payment of the consideration is due).
As at 31 December 2023, the related party receivables contain a €148.0 million (2022: €178.0 million) dividend receivable due from Euronext IP & IT Holding B.V.
Set out below is the movement in the allowance for expected credit losses of trade and contract receivables:
The Company applies the IFRS 9 simplified approach to measuring expected credit losses which uses a lifetime expected loss allowance for its trade and contract receivables. Reference is made to Notes 3 and 37.5 of the Consolidated Financial Statements on the inputs used in establishing the provision matrix used to calculate the loss allowance provision.
Set out below is the information on the credit risk exposure on the Company’s trade and contract receivables using a provision matrix:
Trade receivables In thousands of euros Contract
ReceivablesCurrent 30-60 days past
due61-90 days past
due> 91 days past
dueTotal Expected credit loss rate 0.00 % 0.00 % 0.01 % 0.01 % 0.02 % Collectively assessed receivables 17,164 16,686 3,156 1,642 3,282 41,930 Expected credit loss collective basis – – – – 1 1 Expected credit loss rate 0.00 % 0.00 % 0.00 % 0.00 % 100.00 % Individually assessed receivables – – – – 32 32 Expected credit loss individual basis – – – – 32 32 Total expected credit loss – – – – 33 33 31 December 2022: Trade receivables In thousands of euros Contract
ReceivablesCurrent 30-60 days past
due61-90 days past
due> 91 days past
dueTotal Expected credit loss rate 0.02 % 0.02 % 0.08 % 0.16 % 0.38 % Collectively assessed receivables 11,290 10,452 838 776 2,169 25,525 Expected credit loss collective basis 2 2 1 1 8 14 Expected credit loss rate 0.00 % 0.00 % 0.00 % 0.00 % 100.00 % Individually assessed receivables – – – – 3 3 Expected credit loss individual basis – – – – 3 3 Total expected credit loss 2 2 1 1 11 17 In thousands of euros As at 1 January
2023Loans
advanced /
(settled)Interest
accrued / (paid)As at 31
December 2023Current Euronext Corporate Services B.V. 134,486 – – 134,486 Finance Web Working SAS – – – – Interest receivable on non current intercompany loans 20,601 – (1,771) 18,830 Interest receivable on current intercompany loans 667 – 1,122 1,789 Total 155,754 – (649) 155,105 In thousands of euros As at 1 January
2022Loans
advanced /
(settled)Interest
accrued / (paid)As at 31
December 2022Current Euronext Corporate Services B.V. 134,486 – – 134,486 Finance Web Working SAS 228 (228) – – Interest receivable on non current intercompany loans 26,551 – (5,950) 20,601 Interest receivable on current intercompany loans 62 – 605 667 Total 161,327 (228) (5,345) 155,754 The €134.5 million loan receivable from Euronext Corporate Services B.V. has no maturity and is repayable at lender’s or borrower’s request upon 48 hours’ notice. The interest amounts are paid annually and based on €STER or EURIBOR 3 months reference rates plus 0.125%.
The other current financial assets consist of deposits with a maturity of more than three months on inception date. In 2023, there were no outstanding positions for such securities (2022: €10.0 million).
Cash and cash equivalents included €356.2 million of deposits with a maturity less than three months on inception date (2022: €191.3 million).
Legal reserves and other In thousands of euros Issued
capitalShare
premiumReserve
for own
sharesRetained
earningsProfit for
the yearNon-
distributable
retained
earnings and
other
reserves
regarding
subsidiariesRevaluation
reserve
Reserve for
translation
differencesTotal As at 1 January 2022 171,370 2,423,428 (42,778) 601,051 413,344 40,349 53,038 (12,216) 3,647,586 Share based payments – – – 13,976 – – – – 13,976 Appropriation of the result of preceding year – – – 207,359 (413,344) – – – (205,985) Net result for the period – – – – 437,827 – – – 437,827 Transfers within equity – – – (19,406) – 19,406 – – – Exchange rate differences – – – – – – – (26,169) (26,169) Revaluation subsidiaries – – – 30,919 – – – – 30,919 Other revaluations – – – – – – 19,412 – 19,412 Purchase of shares – – (18) – – – – – (18) Other movements – – 9,960 (13,541) – – – – (3,581) As at 31 December 2022 171,370 2,423,428 (32,836) 820,358 437,827 59,755 72,450 (38,385) 3,913,967 Share based payments – – – 14,134 – – – – 14,134 Appropriation of the result of preceding year – – – 200,636 (437,827) – – – (237,191) Net result for the period – – – – 513,567 – – – 513,567 Transfers within equity – – – (13,160) – 13,160 – – – Exchange rate differences – – – – – – – (50,545) (50,545) Revaluation subsidiaries – – – 4,478 – – – – 4,478 Other revaluations – – – – – – 8,203 – 8,203 Acquisition of NCI subsidiaries – – – (885) – – – – (885) Purchase of shares – – (219,061) – – – – – (219,061) Other movements – – 9,780 (10,756) – – – – (976) As at 31 December 2023 171,370 2,423,428 (242,117) 1,014,805 513,567 72,915 80,653 (88,930) 3,945,691 For further information to the shareholder’s equity, see Note 26 of the Consolidated Financial Statements.
The movements in the shareholder’s equity are before the proposed profit appropriation (see Note 59).
The proposed profit appropriation includes the following items: addition to legal reserves for €13.2 million, addition to retained earnings for €243.6 million and proposed dividends of €256.8 million.
As at 31 December 2023, retained earnings and other reserves from subsidiaries are not freely available for distribution for an amount of €72.9 million relating to legal reserves (2022: €59.8 million). The amount includes a legal reserve for capitalised development costs in Dutch subsidiaries of €51.9 million (2022: €38.5 million).
The revaluation reserve is maintained for the revaluation for the financial assets at FVOCI, net of tax. This reserve is a non-distributable legal reserve.
The reserve for translation differences concerns all exchange rate differences arising from the translation of the net investment in foreign entities and the related goodwill. This reserve is a non-distributable legal reserve.
For additional information on the borrowing positions, a reference is made to Note 29 of the Consolidated Financial Statements.
In thousands of euros As at 1 January
2023Loan
settlements
madeLoans advanced Interest
accrued/(paid)As at 31
December 2023Current Euronext Paris S.A. 67,000 – – – 67,000 Euronext IP & IT Holding B.V. 84,686 – – – 84,686 Euronext Amsterdam N.V. 25,000 – – – 25,000 Euronext Brussels S.A./N.V. 60,000 – – – 60,000 Euronext Corporate Services B.V. 3,500 – – – 3,500 Interest payable on intercompany loan 821 – – 1,672 2,493 Total 241,007 – – 1,672 242,679 In thousands of euros As at 1 January
2022Loan
settlementsmade
Loans advanced Interest
accrued/(paid)As at 31
December 2022Current Euronext Paris S.A. 67,000 – – – 67,000 Euronext IP & IT Holding B.V. 84,686 – – – 84,686 Euronext Amsterdam N.V. 25,000 – – – 25,000 Euronext Brussels S.A./N.V. 60,000 – – – 60,000 Euronext Corporate Services B.V. 3,500 – – – 3,500 Euronext Lisbon S.A. 30,000 (30,000) – – – The Irish Stock Exchange Plc. 30,000 (30,000) – – – Interest payable on intercompany loan 89 – – 732 821 Total 300,275 (60,000) – 732 241,007 The €67.0 million loan payable to Euronext Paris S.A. has no maturity and is repayable at lender’s or borrower’s request upon 48 hours’ notice. The applicable interest was €STER OIS plus 0.125%, payable annually. The sensitivity of the related party loan payables to changes in the interest rate is that a 0.5% increase/decrease of the interest rate will result in an increase/decrease of the interest income by €0.3 million (2022: €0.3 million).
The €84.7 million loan payable to Euronext IP & IT Holding B.V. has no maturity and is repayable at lender’s or borrower’s request upon 48 hours’ notice. The interest is Euribor 3 months plus 0.125% payable annually on two loans. The sensitivity of the related party loan payables to changes in the Euribor interest rate is that a 0.5% increase/decrease of the interest rate will result in an increase/decrease of the interest income by €0.4million (2022: €0.4 million).
The €25.0 million loan payable to Euronext Amsterdam N.V. has no maturity and is repayable at lender’s or borrower’s request upon 48 hours’ notice. The interest was €STER OIS plus 0.125%, payable annually on one loan. The sensitivity of the related party loan payables to changes in the interest rate is that a 0.5% increase/decrease of the interest rate will result in an increase/decrease of the interest income by €0.1 million (2022: €0.1 million).
The €60.0 million loan payable to Euronext Brussels S.A./N.V. has no maturity and is repayable at lender’s or borrower’s request upon 48 hours’ notice. The interest is Euribor 3 months plus 0.125% payable annually on one loan. The sensitivity of the related party loan payables to changes in the interest rate is that a 0.5% increase/decrease of the interest rate will result in an increase/decrease of the interest income by €0.3 million (2022: €0.3 million).
The €3.5 million loan payable to Euronext Corporate Services B.V. has no maturity and is repayable at lender’s or borrower’s request upon 48 hours’ notice. The interest was €STER OIS plus 0.125%, payable annually on one loan.
In 2022, the Company repaid the €30.0 million loan payable to Euronext Lisbon S.A. and the €30.0 million loan payable to The Irish Stock Exchange Plc.
As at 31 December 2023, the amounts due to subsidiaries contains a €387.9 million cash pool position with the subsidiaries (2022: €408.4 million).
The carrying values of current trade and other payables are reasonable approximations of their fair values. These balances do not bear interest.
2023 In thousands of euros Fixed Benefits Variable
BenefitsShare-based
payment costsPost-
employment
benefitsTermination
paymentsTotal Benefits Stéphane Boujnah 1,024 1,425 1,896 – – 4,345 Chris Topple (a) 352 304 324 25 862 1,867 Daryl Byrne 293 200 297 32 – 822 Delphine d’Amarzit 352 270 219 – – 841 Manuel Bento (b) 257 400 105 – – 762 Isabel Ucha 252 140 150 35 – 577 Simone Huis in ’t Veld 310 220 268 23 – 821 Fabrizio Testa 412 378 264 26 – 1,080 Øivind Amundsen 260 201 169 11 – 641 Benoît van den Hove (c) 95 100 22 6 – 223 Vincent van Dessel (c) 235 – 407 21 – 663 Total 3,842 3,638 4,121 179 862 12,642 2022 In thousands of euros Fixed Benefits Variable
BenefitsShare-based
payment costsPost-
employment
benefitsTermination
paymentsTotal Benefits Stéphane Boujnah 880 1,237 1,844 – – 3,961 Chris Topple 431 414 500 30 – 1,375 Daryl Byrne 295 220 300 32 – 847 Delphine d’Amarzit 348 270 144 – – 762 Georges Lauchard (d) 246 – – – – 246 Isabel Ucha 248 160 189 34 – 631 Simone Huis in’t Veld 323 220 264 26 – 833 Fabrizio Testa (e) 255 378 165 8 – 806 Øivind Amundsen 293 227 167 12 – 699 Vincent van Dessel 402 100 237 38 – 777 Total 3,721 3,226 3,810 180 – 10,937 (a) Chris Topple decided to resign from his position as Member of the Managing Board of Euronext N.V. as per 8 November 2023. (b) At the Annual General Meeting held on 17 May 2023, Manuel Bento was appointed as a member of the Managing Board of Euronext N.V. (c) At the Annual General Meeting held on 17 May 2023, Benoît van den Hove was appointed as a member of the Managing Board with effect from 1 July 2023, following the retirement of Vincent van Dessel. (d) Georges Lauchard decided to resign from his position as Chief Operating Officer and Member of the Managing Board of Euronext N.V. as per 10 June 2022. (e) At the Annual General Meeting held on 18 May 2022, Fabrizio Testa was appointed as a member of the Managing Board of Euronext N.V. The Company has not granted any loans, advanced payments and guarantees to the members of the Managing Board and Supervisory Board.
The fixed compensation components consist of base salary and other benefits in kind like company car and health care insurance, if applicable. These components are linked to the overall job responsibilities of the individual Managing Board member and reflect internal consistency.
The variable salary consists of an annual performance compensation component as a percentage of base salary. The percentages are target percentages of the annual base salary, which are only payable if all objectives are met. Performance criteria are set and reviewed on an annual basis by the Remuneration Committee and the Supervisory Board. For 2023, all bonus targets have been met by the Managing Board.
in number of RSU Plan Year of
GrantingOutstanding
as at 1
January 2023Granted Performance
AdjustmentForfeited Vested Outstanding
as at 31
December 2023Stéphane Boujnah LTI 2020 15,397 – 7,406 – (22,803) – LTI 2021 19,275 – – – – 19,275 LTI 2022 15,684 – – – – 15,684 LTI 2023 – 22,522 – – – 22,522 Manuel Bento LTI 2020 (a) 1,244 – 598 – (1,842) – LTI 2021 (a) 1,401 – – – – 1,401 LTI 2022 (a) 1,520 – – – – 1,520 LTI 2023 – 4,279 – – – 4,279 Fabrizio Testa LTI 2021 (a) 2,926 – – – – 2,926 LTI 2022 3,422 – – – – 3,422 LTI 2023 – 4,054 – – – 4,054 Chris Topple LTI 2020 3,768 – 1,812 – (5,580) – LTI 2021 3,663 – – – – 3,663 LTI 2022 4,034 – – (4,034) – – LTI 2023 – 4,669 – (4,669) – – Daryl Byrne LTI 2020 2,520 – 1,212 – (3,732) – LTI 2021 2,365 – – – – 2,365 LTI 2022 2,566 – – – – 2,566 LTI 2023 – 3,040 – – – 3,040 Delphine d’Amarzit LTI 2021 2,628 – – – – 2,628 LTI 2022 2,851 – – – – 2,851 LTI 2023 – 3,378 – – – 3,378 Isabel Ucha LTI 2020 1,431 – 688 – (2,119) – LTI 2021 1,343 – – – – 1,343 LTI 2022 1,457 – – – – 1,457 LTI 2023 – 1,726 – – – 1,726 Øivind Amundsen LTI 2020 1,531 – 736 – (2,267) – LTI 2021 1,576 – – – – 1,576 LTI 2022 1,667 – – – – 1,667 LTI 2023 – 1,723 – – – 1,723 Simone Huis in ’t Veld LTI 2020 2,520 – 1,212 – (3,732) – LTI 2021 2,365 – – – – 2,365 LTI 2022 2,566 – – – – 2,566 LTI 2023 – 3,040 – – – 3,040 Benoît van den Hove LTI 2020 (a) 498 – 240 – (738) – LTI 2021 (a) 467 – – – – 467 LTI 2022 (a) 506 – – – – 506 LTI 2023 – 600 – – – 600 Vincent van Dessel LTI 2020 1,785 – 859 (2,644) – LTI 2021 1,692 – – – – 1,692 LTI 2022 1,909 – – – – 1,909 LTI 2023 – 2,513 – – – 2,513 in number of RSU Plan Year of
GrantingOutstanding
as at 1
January 2022Granted Performance
AdjustmentForfeited Vested Outstanding
as at 31
December 2022Stéphane Boujnah LTI 2019 12,461 – 12,461 – (24,922) – LTI 2020 15,397 – – – – 15,397 LTI 2021 19,275 – – – – 19,275 LTI 2022 – 15,684 – – – 15,684 Fabrizio Testa LTI 2021(a) 2,926 – – – – 2,926 LTI 2022 – 3,422 – – – 3,422 Chris Topple LTI 2019 4,722 – 4,722 – (9,444) – LTI 2020 3,768 – – – – 3,768 LTI 2021 3,663 – – – – 3,663 LTI 2022 – 4,034 – – – 4,034 Daryl Byrne LTI 2019 3,479 – 3,479 – (6,958) – LTI 2020 2,520 – – – – 2,520 LTI 2021 2,365 – – – – 2,365 LTI 2022 – 2,566 – – – 2,566 Delphine d’Amarzit LTI 2021 2,628 – – – – 2,628 LTI 2022 – 2,851 – – – 2,851 Georges Lauchard LTI 2020 3,360 – – (3,360) – – LTI 2021 3,154 – – (3,154) – – Isabel Ucha LTI 2019 1,976 – 1,976 – (3,952) – LTI 2020 1,431 – – – – 1,431 LTI 2021 1,343 – – – – 1,343 LTI 2022 – 1,457 – – – 1,457 Øivind Amundsen LTI 2020 1,531 – – – – 1,531 LTI 2021 1,576 – – – – 1,576 LTI 2022 – 1,667 – – – 1,667 Simone Huis in ’t Veld LTI 2020 2,520 – – – – 2,520 LTI 2021 2,365 – – – – 2,365 LTI 2022 – 2,566 – – – 2,566 Vincent van Dessel LTI 2019 2,419 – 2,419 – (4,838) – LTI 2020 1,785 – – – – 1,785 LTI 2021 1,692 – – – – 1,692 LTI 2022 – 1,909 – – – 1,909 For additional information on the value of awards granted to the Managing Board reference is made to Note 28 of the Consolidated Financial Statements.
The audit services relate to the financial year to which the financial statements relate, regardless of whether the activities were performed by the external auditor and the audit firm during the financial year. In addition to the performance of the statutory audit of the Group financial statements and other (statutory) financial statements of Euronext N.V. and its subsidiaries, EY provides a number of other assurance services. These other assurance services consist of the review of the half year interim financial statements and work related to the registration document. The comparative figures have been adjusted accordingly, in line with the relevant EU regulation.
The total fees of EY Netherlands, charged to Euronext N.V. and its consolidated group entities amounted to €1.7 million in 2023 (2022: €1.7 million).
The Company is the head of a fiscal unity with Euronext Amsterdam NV, Euronext IP & IT Holding BV, Euronext Corporate Services BV, Company Webcast BV and Ibabs BV. Under the standard conditions, the members of the tax group are jointly and severally liable for any taxes payable by the fiscal unity. Each company within the fiscal unity recognises its own tax position on its company balance sheet.
The financial statements of Euronext NV, Euronext Amsterdam NV, Euronext IP & IT Holding BV, Ibabs BV and Euronext Corporate Services BV. recognise a tax liability based on their taxable profit.
The Company participates in a number of guarantees. Within the Group, the Company act in the guarantor for certain liabilities of its subsidiary up to an amount of €7.4 million (2022: €7.6 million). In addition, the Company has provided a 403 statement for the benefit of Euronext Amsterdam NV and Ibabs BV. It should be noted that the Group consistently waives guarantee fees for intergroup guarantees, meaning these transactions are not at arm’s length.
In respect of the year ended 31 December 2023, a dividend representing a 50% pay out ratio on net profit, amounting to a total of €256.8 million is to be proposed to the annual general meeting on 15 May 2024. This represents a dividend of €2.48 per share based on the number of shares outstanding at 31 December 2023.
In respect of the year ended 31 December 2022, a dividend representing a 50% pay out ratio on net profit, (adjusted for the net loss realized on the Euronext Clearing Investment portfolio amounting to €35.3 million) amounting to a total of €236.6 million was proposed to and voted by the annual general meeting on 16 May 2023. This represented a dividend of €2.22 per share based on the number of shares outstanding at 31 December 2022.
In 2023, a total amount of €13.2 million was added to the legal reserves, which related to capitalised development costs in Dutch subsidiaries.
In 2022, a total amount of €19.4 million was added to the legal reserves, which related to capitalised development costs in Dutch subsidiaries.
-
9 Other information
9.1 Profit Appropriation Section
Article 28.2 of the Articles of Association states that from the profits, as they appear from the adopted annual accounts, first, in the event that the priority share has been issued and is held by a party other than the Company, a dividend of ten per cent (10%) of the par value of the priority share will be paid to the holder of the priority share. The profits which remain after application of the first sentence of this Article 28.2 shall be at the free disposal of the General Meeting, provided that there shall be no further distribution on the priority share, and provided that the General Meeting may only resolve on any reservation or distribution of profits pursuant to and in accordance with a proposal thereto of the Supervisory Board or a proposal of the Managing Board, which proposal has been approved by the Supervisory Board.
-
9.2 Independent Auditor’s Report
Report on the audit of the financial statements 2023 included in the universal registration document
We have audited the financial statements 2023 of Euronext N.V. (hereinafter: Euronext or the company) based in Amsterdam, the Netherlands. The financial statements comprise the consolidated and company financial statements.
■ The accompanying consolidated financial statements give a true and fair view of the financial position of Euronext as at 31 December 2023 and of its result and its cash flows for 2023 in accordance with International Financial Reporting Standards as adopted in the European Union (EU-IFRSs) and with Part 9 of Book 2 of the Dutch Civil Code ■ The accompanying company financial statements give a true and fair view of the financial position of Euronext as at 31 December 2023 and of its result for 2023 in accordance with Part 9 of Book 2 of the Dutch Civil Code We conducted our audit in accordance with Dutch law, including the Dutch Standards on Auditing. Our responsibilities under those standards are further described in the Our responsibilities for the audit of the financial statements section of our report.
We are independent of Euronext in accordance with the EU Regulation on specific requirements regarding statutory audit of public-interest entities, the Wet toezicht accountantsorganisaties (Wta, Audit firms supervision act), the Verordening inzake de onafhankelijkheid van accountants bij assurance-opdrachten (ViO, Code of Ethics for Professional Accountants, a regulation with respect to independence) and other relevant independence regulations in the Netherlands. Furthermore we have complied with the Verordening gedrags- en beroepsregels accountants (VGBA, Dutch Code of Ethics).
We believe the audit evidence we have obtained is sufficient and appropriate to provide a basis for our opinion.
We designed our audit procedures in the context of our audit of the financial statements as a whole and in forming our opinion thereon. The following information in support of our opinion and any findings were addressed in this context, and we do not provide a separate opinion or conclusion on these matters.
Euronext is a European market infrastructure group which businesses comprise listing, cash trading, derivatives trading, fixed income trading, spot FX trading, power trading, investor services, advanced data services, post-trade services as well as technology solutions. The main subsidiaries are located in the Netherlands, France, Italy, Belgium, Ireland, Norway, Portugal and Denmark. The FX trading is operated by a subsidiary in New York.
The group is structured in components and we tailored our group audit approach accordingly. We paid specific attention in our audit to a number of areas driven by the operations of the group and our risk assessment.
We determined materiality and identified and assessed the risks of material misstatement of the financial statements, whether due to fraud or error in order to design audit procedures responsive to those risks and to obtain audit evidence that is sufficient and appropriate to provide a basis for our opinion.
Materiality €34 million (2022: €30 million) Benchmark applied Approximately 5% of profit before income tax (2022: approximately 5% of profit before income tax) Explanation We consider profit before income tax as the most appropriate basis to determine materiality as it is one of the key performance measures for the users of the financial statements. We have also taken into account misstatements and/or possible misstatements that in our opinion are material for the users of the financial statements for qualitative reasons.
We agreed with the supervisory board that misstatements in excess of € 1.7 million, which are identified during the audit, would be reported to them, as well as smaller misstatements that in our view must be reported on qualitative grounds.
Euronext is at the head of a group of entities (components). The financial information of this group is included in the consolidated financial statements.
Because we are ultimately responsible for the opinion, we are also responsible for directing, supervising and performing the group audit. In this respect we have determined the nature and extent of the audit procedures to be carried out for the components. Decisive were the size and/or the risk profile of the group entities or operations. On this basis, we selected components for which an audit or review had to be carried out on the complete set of financial information or specific items.
Our group audit mainly focused on significant components of Euronext in the Netherlands, France, Italy, Norway, Ireland, Portugal, Denmark and the United States. We have:
■ Performed audit procedures ourselves at the components in the Netherlands and France; ■ Used the work of other component auditors from EY Global member firms when auditing the components in Italy, Norway, Ireland, Portugal and Denmark ■ Used the work of non-EY auditors for the audit of a component in the United States. We sent instructions to component auditors, covering the significant areas and the information required to be reported to us. Based on our risk assessment, we determined the level of involvement in component audits. We have visited the component team in Italy. Our site visits encompassed some, or all, of the following activities: reviewing key local working papers and conclusions, meeting with local management teams and obtaining an understanding of key processes. We interacted regularly with the component teams during various stages of the audit and reviewed key working papers of component auditors.
In total, with these procedures we covered 95% of profit before income tax and 99% of the group’s total assets. By performing the procedures mentioned above at components, together with additional procedures at group level, we have been able to obtain sufficient and appropriate audit evidence about the group’s financial information to provide an opinion on the consolidated financial statements.
We ensured that the audit teams both at group level and at component level included the appropriate skills and competences which are needed for an audit of a listed client in the market infrastructure industry. We included team members with specialized knowledge in the areas of IT audit and forensics and have made use of our own specialists in the areas of valuation of financial investments, employee benefits, income tax, purchase price accounting and impairment analyses of goodwill and other intangibles.
Climate change and the energy transition are high on the public agenda and lead to significant change for many businesses and society. The managing board of Euronext has reported in chapter 3 ‘Empower sustainable finance’ of the universal registration document how the company is addressing climate-related and environmental risks. Euronext has identified 11 key issues that impact its sustainable development goals that it considers most relevant per impact area: our markets, our partners, our people our society and our environment. We refer to chapter 3.4 “Euronext five ESG impact areas and the sustainable development goals” of the universal registration document where the managing board discloses its progress made against its key ESG issues, supporting Euronext’s five material impact areas.
As part of our audit of the financial statements, we evaluated the extent to which climate-related risks and the effects of the energy transition and Euronext’s development goals are taken into account in estimates and significant assumptions as well as in the design of relevant internal control measures. Furthermore, we read the universal registration document and considered whether there is any material inconsistency between the non-financial information in chapter 3 “Empower sustainable finance” and the financial statements.
Based on the audit procedures performed, we do not deem climate-related risks to have a material impact on the financial reporting judgements, estimates or significant assumptions as at 31 December 2023.
Although we are not responsible for preventing fraud or non-compliance and we cannot be expected to detect non-compliance with all laws and regulations, it is our responsibility to obtain reasonable assurance that the financial statements, taken as a whole, are free from material misstatement, whether caused by fraud or error. The risk of not detecting a material misstatement resulting from fraud is higher than for one resulting from error, as fraud may involve collusion, forgery, intentional omissions, misrepresentations, or the override of internal control.
We identified and assessed the risks of material misstatements of the financial statements due to fraud. During our audit we obtained an understanding of the company and its environment and the components of the system of internal control, including the risk assessment process and the managing board’s process for responding to the risks of fraud and monitoring the system of internal control and how the supervisory board exercises oversight, as well as the outcomes. We refer to chapter 2 “Risk management & control” of the universal registration document of Euronext for the managing board’s risk assessment after consideration of potential fraud risks.
We evaluated the design and relevant aspects of the system of internal control and in particular the fraud risk assessment, as well as the code of business conduct and ethics, the Euronext anti-fraud and anti-bribery policies, whistleblower policy and incident registration. We evaluated the design and the implementation and, where considered appropriate, tested the operating effectiveness, of internal controls designed to mitigate fraud risks.
As part of our process of identifying fraud risks, we evaluated fraud risk factors with respect to financial reporting fraud, misappropriation of assets and bribery and corruption in close co-operation with our forensic specialists. We evaluated whether these factors indicate that a risk of material misstatement due to fraud is present.
We incorporated elements of unpredictability in our audit. We also considered the outcome of our other audit procedures and evaluated whether any findings were indicative of fraud or non-compliance.
We addressed the risks related to management override of controls, as this risk is present in all companies. For these risks we have performed procedures among other things to evaluate key accounting estimates for management bias that may represent a risk of material misstatement due to fraud, in particular relating to important judgment areas and significant accounting estimates as disclosed in the “critical accounting estimates and judgements” section of the accounting policies in the notes to the financial statements. We have also used data analysis to identify and address high-risk journal entries and evaluated the business rationale (or the lack thereof) of significant extraordinary transactions, including those with related parties.
Additionally, as described in our key audit matter related to the “Recognition of internally developed software”, given the amount of capitalized software development expenses during the year, we specifically considered whether management’s judgment involved in determining whether IAS 38 “Intangible assets” capitalization criteria have been met indicates a management bias that may represent a risk of material misstatement due to fraud.
When identifying and assessing fraud risks we presumed that there are risks of fraud in revenue recognition. We evaluated that revenues for the access to Euronext’s market data information services as part of the revenues from advance data services in particular give rise to this fraud risk, given inherent limitations in Euronext’s revenue calculation system. We designed and performed our audit procedures relating to revenue recognition responsive to this presumed fraud risk and we sent out confirmations to customers and used data analysis procedures to recalculate the advanced data services revenue.
We considered available information and made enquiries of the managing board, relevant executives, internal audit, legal, compliance, risk management and the supervisory board.
The fraud risks we identified, enquiries and other available information did not lead to specific indications for fraud or suspected fraud potentially materially impacting the view of the financial statements.
We performed appropriate audit procedures regarding compliance with the provisions of those laws and regulations that have a direct effect on the determination of material amounts and disclosures in the financial statements. Furthermore, we assessed factors related to the risks of non-compliance with laws and regulations that could reasonably be expected to have a material effect on the financial statements from our general industry experience, through discussions with the managing board, relevant executives, internal audit, legal, compliance and risk management, and the supervisory board, reading minutes, inspection of internal audit and compliance reports, and performing substantive tests of details of classes of transactions, account balances or disclosures.
We also inspected lawyers’ letters and correspondence with regulatory authorities and remained alert to any indication of (suspected) non-compliance throughout the audit. Finally we obtained written representations that all known instances of non-compliance with laws and regulations have been disclosed to us.
As disclosed in section 3. A). “Basis of preparation” of the notes to the consolidated financial statements, the financial statements have been prepared on a going concern basis. When preparing the financial statements, the managing board made a specific assessment of the company’s ability to continue as a going concern and to continue its operations for at least twelve months from the date of preparation of the financial statements and confirmed this in section 4.2 “In Control Statement” of the universal registration document.
We discussed and evaluated the specific assessment with the managing board exercising professional judgment and maintaining professional skepticism. We considered whether the managing board’s going concern assessment, based on our knowledge and understanding obtained through our audit of the financial statements or otherwise, contains all relevant events or conditions that may cast significant doubt on the company’s ability to continue as a going concern, with a focus on whether the company will continue to comply with regulatory liquidity and solvency requirements. If we conclude that a material uncertainty exists, we are required to draw attention in our auditor’s report to the related disclosures in the financial statements or, if such disclosures are inadequate, to modify our opinion.
Based on our procedures performed, we did not identify material uncertainties about going concern. Our conclusions are based on the audit evidence obtained up to the date of our auditor’s report. However, future events or conditions may cause a company to cease to continue as a going concern.
Key audit matters are those matters that, in our professional judgment, were of most significance in our audit of the financial statements. We have communicated the key audit matters to the supervisory board. The key audit matters are not a comprehensive reflection of all matters discussed.
Impairment of goodwill and other purchased intangible assets Risk Euronext accounts for a significant amount of goodwill and customer relationships on its consolidated balance sheet. As described in note 18, goodwill amounts to €4 billion as at 31 December 2023 and other purchased intangible assets have a value of €2 billion mostly consisting of acquired customer relations which have a finite useful life. Management is required to perform annually an impairment test of goodwill. Where indicators of impairment of other purchased intangible assets are identified, a detailed impairment test is performed. These impairment tests involve judgement in applying assumptions in the valuation models.
Key judgements and estimates used in the valuation models include cash flow projections, revenue growth, discount rates, amortization periods for intangible assets and customer retention rates. The goodwill impairment test is disclosed in note 18 with reference to note 3 and did not result in recognition of an impairment. As disclosed in note 18, no indicators of impairment of other intangible assets with a finite useful life were identified.
We have determined the impairment of goodwill and other purchased intangibles to be a key audit matter due to the size of the goodwill and intangible assets as at 31 December 2023 and the use of judgement by management in the impairment test.
Our audit approach Our audit procedures included, amongst others, evaluating the appropriateness of Euronext’s accounting policies related to the impairment testing in accordance with IAS 36 “Impairment of assets”. We obtained an understanding of the impairment process, evaluated the design of internal controls in respect of impairment testing and adopted a substantive audit approach. We performed substantive procedures, including the reconciliation of the data used in the impairment calculations and disclosures to source systems.
With involvement of our own specialists in the area of impairment analyses of goodwill and other intangibles, we evaluated the model used by Euronext and tested key inputs applied in the goodwill impairment test such as the discount rates and growth rates assigned to each of the cash generating units and we evaluated these key inputs by comparing them to a range of economic and industry forecasts.
We assessed the accuracy of forecasts included in the model by comparing the forecasts with the 2024 budget and 2025 business plan as approved by the managing and supervisory boards and evaluated the reasonableness of cash flow forecasts by analyzing the revenue growth rates used. We performed sensitivity analysis on the key assumptions (including the model inputs, cash flow forecasts and customer retention rates) used in the models to understand the impact that reasonably possible changes to these key inputs would have on the carrying amount of the goodwill and could trigger a potential impairment of purchased intangible assets at the balance sheet date.
Finally, we evaluated the adequacy of the relevant disclosures made in the financial statements.
Key observations Based on our procedures performed we consider the valuation of the goodwill and other purchased intangible assets to be reasonable in accordance with EU-IFRSs. Recognition of internally developed software Risk The capitalization of expenses for internally developed software involves judgement in assessing the capitalization against the recognition criteria set out in IAS 38 “Intangible assets”. Euronext’s accounting policy for capitalizing software development costs is disclosed in section 3, under H). (ii) “Internally generated intangible assets”. As disclosed in note 18 of the financial statements internally developed software capitalization amounts to € 167 million as per 31 December 2023.
We have determined the recognition of internally developed software as an intangible asset to be a key audit matter following the internally developed software investments related to among others the ongoing implementation of trading platform Optiq at Borsa Italiana and the expansion of the clearing activities to all Euronext markets, the use of judgement by management in determining whether the recognition criteria were met and the audit effort required to address the matter. We specifically considered the risk that expenses are capitalized inappropriately as internally developed software. The internally developed software recognised is disclosed in note 18 “Goodwill and other intangible assets” to the financial statements.
Our audit approach We evaluated Euronext’s accounting polices related to the recognition of internally developed software in accordance with IAS 38, and whether assumptions and the criteria applied for capitalization are appropriate and have been applied consistently. We also obtained an understanding of the recognition process, evaluated the design and implementation of internal controls. We adopted a substantive audit approach and performed procedures in respect of the capitalized software development costs, including the reconciliation of the data used in the calculations and disclosures to source systems.
For a sample of additions, we have agreed amounts recognized to supporting documentation to confirm that the costs were incurred and the internally developed software meets the definition of an intangible asset and the recognition criteria of IAS 38. For all intangible assets we have tested the appropriateness of the amortization period based on historic trends of economic lives and management’s best estimate of future performance.
Finally, we evaluated the adequacy of the relevant disclosures made in the financial statements.
Key observations Based on our procedures performed we consider the recognition of internally developed software to be reasonable and in accordance with EU-IFRSs. Measurement of financial assets at fair value through other comprehensive income Risk Euronext holds a direct and an indirect minority interest in Euroclear S.A.
As described in note 20 to the financial statements this investment is classified as a financial asset at fair value through other comprehensive income.
As Euroclear is a non-listed company, Euronext developed an internal model to estimate the fair value, as disclosed in note 35 to the financial statements.
A weighted approach is applied which is based on the return on equity, expected dividend growth rate (non-observable parameters) and cost of capital of comparable regulated entities and market observable transactions less a discount for illiquidity. In 2023, Euronext revalued its total interest by €12 million, increasing the fair value to €261 million.
The determination of the fair value of the interest in Euroclear involves significant management judgment and assumptions as certain unobservable inputs are used. The use of different valuation techniques and assumptions can produce significantly different estimate of fair value. Given the inherent subjectivity we determined this a key matter for our audit.
Our audit approach Our audit procedures comprised, amongst others, evaluating the appropriateness of Euronext’s accounting policies related to the fair valuation of an interest in a non-listed company according to IFRS 9 “Financial Instruments” and IFRS 13 ”Fair value measurement”. The procedures performed included an evaluation of the methodology and the appropriateness of the valuation model for consistency and an assessment against generally accepted market practice and inputs used to value the investments. We also obtained an understanding of the valuation process, evaluated the design and implementation of internal controls and adopted a substantive audit approach.
We used our specialists in the area of valuation of financial investments to independently evaluate the valuation performed. As part of these audit procedures, we tested the reasonableness of key inputs used in the valuation such as the market observable transfers, and the non-observable parameters, the return on equity and expected dividend growth rates.
Finally, we evaluated the adequacy of the disclosures related to financial assets at fair value through other comprehensive income. In particular we evaluated whether disclosures adequately convey the degree of estimation uncertainty and the range of possible outcomes.
Key observations We consider the measurement of and disclosures on the financial assets at fair value through other comprehensive income to be reasonable and in accordance with EU-IFRS. Reliability and continuity of the IT environment Risk The activities and financial reporting of Euronext are highly dependent on the reliability and continuity of the IT environment. Effective general IT controls with respect to change management, logical access, infrastructure and operations, support the integrity and continuity of the electronic data processing as well as the operating effectiveness of the automated controls.
As described in the risk management Section 2 in the universal registration document, the IT environment and the IT organization of Euronext continue to be strengthened. There is a risk that the general IT control measures may not always operate as intended and, as a result, internal controls are ineffective. Therefore, we identified the reliability and continuity of the IT environment, insofar in scope of our audit of the financial statements, to be a key audit matter.
Our audit approach IT audit specialists are an integral part of the engagement team and assess the reliability and continuity of the IT environment to the extent necessary for the scope of our audit of the financial statements. In this context, we evaluated the design of the IT processes and tested the operating effectiveness of general IT controls, as well as application controls over data processing, data feeds and interfaces where relevant for the financial reporting.
We performed procedures on access management, cyber security, security event monitoring and segregation of duties for the related systems. We also assessed the possible impact of changes in IT during the year resulting from the internal transformation activities and remedial measures on the operating effectiveness of general IT controls and the automated controls. Where applicable, we tested internal controls related to cloud computing and third-party service providers.
Where applicable, we tested internal controls related to cloud computing and third-party service providers.
Key observations Our testing of the general IT controls and the substantive tests performed, provided sufficient evidence to enable us to rely on the adequate and continued IT environment relevant for our audit of the financial statements. The universal registration document contains other information in addition to the financial statements and our auditor’s report thereon.
■ Is consistent with the financial statements and does not contain material misstatements. ■ Contains the information as required by Part 9 of Book 2 of the Dutch Civil Code for the management report and the other information as required by Part 9 of Book 2 of the Dutch Civil Code and as required by Sections 2:135b and 2:145 sub-section 2 of the Dutch Civil Code for the remuneration report. We have read the other information. Based on our knowledge and understanding obtained through our audit of the financial statements or otherwise, we have considered whether the other information contains material misstatements. By performing these procedures, we comply with the requirements of Part 9 of Book 2 and Section 2:135b sub-Section 7 of the Dutch Civil Code and the Dutch Standard 720. The scope of the procedures performed is substantially less than the scope of those performed in our audit of the financial statements.
The managing board is responsible for the preparation of the other information, including the management report in accordance with Part 9 of Book 2 of the Dutch Civil Code and other information required by Part 9 of Book 2 of the Dutch Civil Code. The managing board and the supervisory board are responsible for ensuring that the remuneration report is drawn up and published in accordance with Sections 2:135b and 2:145 sub-section 2 of the Dutch Civil Code.
We were engaged by the general meeting of shareholders as auditor of Euronext on 19 May 2017, as of the audit for the year 2017 and have operated as statutory auditor since that date.
We have not provided prohibited non-audit services as referred to in Article 5(1) of the EU Regulation on specific requirements regarding statutory audit of public-interest entities.
Euronext has prepared the universal registration document in ESEF. The requirements for this are set out in the Delegated Regulation (EU) 2019/815 with regard to regulatory technical standards on the specification of a single electronic reporting format (hereinafter: the RTS on ESEF).
In our opinion the universal registration document prepared in the XHTML format, including the partially marked-up consolidated financial statements as included in the reporting package by Euronext, complies in all material respects with the RTS on ESEF.
The managing board is responsible for preparing the universal registration document, including the financial statements, in accordance with the RTS on ESEF, whereby the managing board combines the various components into a single reporting package.
Our responsibility is to obtain reasonable assurance for our opinion whether the universal registration document in this reporting package complies with the RTS on ESEF.
We performed our examination in accordance with Dutch law, including Dutch Standard 3950N, “Assurance-opdrachten inzake het voldoen aan de criteria voor het opstellen van een digitaal verantwoordingsdocument” (assurance engagements relating to compliance with criteria for digital reporting). Our examination included amongst others:
■ Obtaining an understanding of the company’s financial reporting process, including the preparation of the reporting package ■ Identifying and assessing the risks that the annual report does not comply in all material respects with the RTS on ESEF and designing and performing further assurance procedures responsive to those risks to provide a basis for our opinion, including: ■ Obtaining the reporting package and performing validations to determine whether the reporting package containing the Inline XBRL instance document and the XBRL extension taxonomy files, has been prepared in accordance with the technical specifications as included in the RTS on ESEF ■ Examining the information related to the consolidated financial statements in the reporting package to determine whether all required mark-ups have been applied and whether these are in accordance with the RTS on ESEF. The managing board is responsible for the preparation and fair presentation of the financial statements in accordance with EU-IFRSs and Part 9 of Book 2 of the Dutch Civil Code. Furthermore, the managing board is responsible for such internal control as the managing board determines is necessary to enable the preparation of the financial statements that are free from material misstatement, whether due to fraud or error.
As part of the preparation of the financial statements, the managing board is responsible for assessing the company’s ability to continue as a going concern. Based on the financial reporting framework mentioned, the managing board should prepare the financial statements using the going concern basis of accounting unless the managing board either intends to liquidate the company or to cease operations, or has no realistic alternative but to do so. The managing board should disclose events and circumstances that may cast significant doubt on the company’s ability to continue as a going concern in the financial statements.
Our objective is to plan and perform the audit engagement in a manner that allows us to obtain sufficient and appropriate audit evidence for our opinion.
Our audit has been performed with a high, but not absolute, level of assurance, which means we may not detect all material errors and fraud during our audit.
Misstatements can arise from fraud or error and are considered material if, individually or in the aggregate, they could reasonably be expected to influence the economic decisions of users taken on the basis of these financial statements. The materiality affects the nature, timing and extent of our audit procedures and the evaluation of the effect of identified misstatements on our opinion.
We have exercised professional judgment and have maintained professional skepticism throughout the audit, in accordance with Dutch Standards on Auditing, ethical requirements and independence requirements. The Information in support of our opinion section above includes an informative summary of our responsibilities and the work performed as the basis for our opinion.
■ Performing audit procedures responsive to the risks identified, and obtaining audit evidence that is sufficient and appropriate to provide a basis for our opinion ■ Obtaining an understanding of internal control relevant to the audit in order to design audit procedures that are appropriate in the circumstances, but not for the purpose of expressing an opinion on the effectiveness of the company’s internal control ■ Evaluating the appropriateness of accounting policies used and the reasonableness of accounting estimates and related disclosures made by the managing board ■ Evaluating the overall presentation, structure and content of the financial statements, including the disclosures ■ Evaluating whether the financial statements represent the underlying transactions and events in a manner that achieves fair presentation We communicate with the supervisory board regarding, among other matters, the planned scope and timing of the audit and significant audit findings, including any significant findings in internal control that we identify during our audit. In this respect we also submit an additional report to the audit committee of the supervisory board in accordance with Article 11 of the EU Regulation on specific requirements regarding statutory audit of public-interest entities. The information included in this additional report is consistent with our audit opinion in this auditor’s report.
We provide the supervisory board with a statement that we have complied with relevant ethical requirements regarding independence, and to communicate with them all relationships and other matters that may reasonably be thought to bear on our independence, and where applicable, related safeguards.
From the matters communicated with the supervisory board, we determine the key audit matters: those matters that were of most significance in the audit of the financial statements. We describe these matters in our auditor’s report unless law or regulation precludes public disclosure about the matter or when, in extremely rare circumstances, not communicating the matter is in the public interest.
-
9.3 Limited assurance report of the independent auditor on selected ESG Key Performance Indicators
We have performed a limited assurance engagement on selected ESG Key Performance Indicators (hereinafter: ESG KPIs) in the accompanying Universal Registration Document for the year 2023 of Euronext N.V. at Amsterdam. Based on our procedures performed and the assurance information obtained, nothing has come to our attention that causes us to believe that the selected ESG KPIs are not prepared, in all material respects, in accordance with the applicable criteria as included in the section “Criteria”. The selected ESG KPIs are included in chapter “3.5 Summary ESG KPI” and consist of:
Impact areas KPIs Our markets 1. Number of serious incidents on the regulated markets reported to the College of Regulators
2. Number of operational alerts treated by EMS
3. Availability time of the system Optiq®
4. Proportion of revenues linked to ESG products and services in the global revenues of the group
Our partners 5. Net Promoter Score
6. Percentage of suppliers with SBTi set reduction targets on Scope 1 and Scope 2 GHG emissions
Our people 7. Percentage of women in the Senior Leadership Team Our society 8. Use of the Whistleblower mechanism
9. Data Protection training by new joiners to the company
10. Personal Data breaches
Our environment 11. Carbon footprint (location based We have performed our limited assurance engagement on the selected ESG KPIs in accordance with Dutch law, including Dutch Standard 3000A ‘Assurance-opdrachten anders dan opdrachten tot controle of beoordeling van historische financiële informatie (attest-opdrachten)’ (Assurance engagements other than audits or reviews of historical financial information (attestation engagements)). Our responsibilities in this regard are further described in the section “Our responsibilities for the assurance engagement on the selected ESG KPIs” of our report.
We are independent of Euronext N.V. in accordance with the “Verordening inzake de onafhankelijkheid van accountants bij assurance-opdrachten” (ViO, Code of Ethics for Professional Accountants, a regulation with respect to independence). This includes that we do not perform any activities that could result in a conflict of interest with our independent assurance engagement. Furthermore, we have complied with the “Verordening gedrags- en beroepsregels accountants” (VGBA, Dutch Code of Ethics for Professional Accountants). We believe that the assurance evidence we have obtained is sufficient and appropriate to provide a basis for our conclusion.
The criteria applied for the preparation of the selected ESG KPIs are the criteria developed by Euronext N.V. and are disclosed in chapter 3.5 Summary ESG KPI” of the Universal Registration Document.
The comparability of ESG KPIs between entities and over time may be affected by the absence of a uniform practice on which to draw, to evaluate and measure this information. This allows for the application of different, but acceptable, measurement techniques.
Consequently, the selected ESG KPIs need to be read and understood together with the criteria applied.
The adjusted carbon footprint figures for the period 2022 have not been part of the assurance engagement. Consequently, the corresponding adjusted carbon footprint figures and thereto related disclosures for the period 2022 are not assured. Our conclusion is not modified in respect of this matter.
Our assurance engagement is restricted to the selected ESG KPIs. We have not performed assurance procedures on any other information as included in the Universal Registration Document in light of this engagement.
The managing board is responsible for the preparation of the selected ESG KPIs in accordance with the criteria as included in the section “Criteria”. The managing board is also responsible for selecting and applying the criteria and for determining that these criteria are suitable for the legitimate information needs of the intended users, considering applicable law and regulations related to reporting. The choices made by the managing board regarding the scope of the selected ESG KPIs and the reporting policy are summarized chapter “3.5 Summary ESG KPI” of the Universal Registration Document.
Furthermore, the managing board is responsible for such internal control as it determines is necessary to enable the preparation of the selected ESG KPIs that are free from material misstatement, whether due to fraud or error.
The supervisory board is responsible for overseeing the reporting process of the selected ESG KPIs of Euronext N.V.
Our responsibility is to plan and perform the assurance engagement in a manner that allows us to obtain sufficient and appropriate assurance evidence for our conclusion.
Our assurance engagement is aimed to obtain a limited level of assurance to determine the plausibility of the selected ESG KPIs. The procedures vary in nature and timing from, and are less in extent, than for a reasonable assurance engagement. The level of assurance obtained in a limited assurance engagement is therefore substantially less than the assurance that is obtained when a reasonable assurance engagement is performed.
We apply the ‘Nadere voorschriften kwaliteitssystemen’ (NVKS, regulations for quality management systems) and accordingly maintain a comprehensive system of quality management including documented policies and procedures regarding compliance with ethical requirements, professional standards and other relevant legal and regulatory requirements.
■ Performing an analysis of the external environment and obtaining an understanding of the sector, insight into relevant sustainability themes and issues and the characteristics of the company as far as relevant to the selected ESG KPIs ■ Evaluating the appropriateness of the criteria applied, their consistent application and related disclosures on the selected ESG KPIs. This includes the evaluation of the reasonableness of estimates made by the managing board ■ Obtaining through inquiries a general understanding of the internal control environment, the reporting processes, the information systems and the entity’s risk assessment process relevant to the preparation of the selected ESG KPIs, without obtaining assurance information about the implementation or testing the operating effectiveness of controls ■ Identifying areas of the selected ESG KPIs where misleading or unbalanced information or a material misstatement, whether due to fraud or error, is likely to arise. Designing and performing further assurance procedures aimed at determining the plausibility of the selected ESG KPIs responsive to this risk analysis. These procedures consisted amongst others of: - Making inquiries of management and relevant staff at corporate level responsible for the sustainability strategy, policy and results relating to the selected ESG KPIs - Interviewing relevant staff responsible for providing the information for, carrying out controls on, and consolidating the data in the selected ESG KPIs - Obtaining assurance evidence that the selected ESG KPIs reconcile with underlying records of Euronext N.V. - Reviewing, on a limited sample basis, relevant internal and external documentation - Considering the data and trends in the information submitted for consolidation at corporate level ■ Reconciling the relevant financial information with the financial statements ■ Reading the information in Universal Registration Document that is not included in the scope of our assurance engagement to identify material inconsistencies, if any, with the selected ESG KPIs ■ Considering whether the selected ESG KPIs are presented and disclosed free from material misstatement in accordance with the criteria applied. -
GLOSSARY & CONCORDANCE TABLES & ANNEX
ACPR The French Prudential Supervision and Resolution Authority (Autorité de Contrôle Prudentiel et de Résolution) AFM Stichting Autoriteit Financiële Markten, the Netherlands Authority for the Financial Markets Alternext Former name for Euronext’s multilateral trading facilities (MTFs) in Paris, Brussels, Lisbon, Oslo and Milan, now called Euronext Growth AMF French Authority for the Financial Markets (Autorité des Marchés Financiers) Articles of Association The Articles of Association (statuten) of the Company Brexit British exit, referring to the UK’s decision in a referendum on 23 June 2016 to leave the European Union CAGR Compounded annual growth rate Cash Clearing Agreement The Cash Clearing Agreement entered into between Euronext and certain of its affiliates and LCH SA S.A. and LCH SA Group Limited on 22 January 2013 CC&G Multi-asset clearing house owned by Euronext since 29 April 2021 CCPs Central counterparties CDP Carbon Disclosure Project: CDP is a not-for-profit organisation that runs the global disclosure system for investors, companies, cities, states and regions to manage their environmental impacts. Central Order Book Providing access to the deepest liquidity pool in Europe connecting Euronext’s regulated markets in Amsterdam, Brussels, Dublin, Lisbon, Oslo and Paris. CEO Chief Executive Officer CFO Chief Financial Officer Clearing Services Clearing Services is the procedure by which an organisation (CCP) acts as an intermediary and assumes the role of a buyer and seller in a transaction through the process of novation in order to reconcile orders between transacting parties. CMVM Comissão do Mercado de Valores Mobiliários, the Portuguese Securities Markets Commission Code of business conduct and ethics Code that reaffirms the Euronext N.V.’s commitment to high standards of ethical conduct and reinforces its business ethics, policies and procedures CONSOB Commissione Nazionale per le Società e la Borsa, the regulatory authority for the Italian securities market Company Euronext N.V. and its consolidated subsidiaries, unless otherwise indicated Compliance department The Compliance department of Euronext N.V. COO Chief Operating Officer Core Items The intellectual property in the UTP and other trading technology, including core software and technology CSD central securities depositories CSD Regulation EU Regulation on securities settlement and central securities depositories (published on the Official Journal of the European Union on 23 July 2014) D2C Dealer-to-Client D2D Dealer-to-Dealer Derivatives
Clearing Agreement
The Derivatives Clearing Agreement entered into between Euronext and certain of its affiliates and LCH SA S.A. and LCH SA Group Limited on 14 October 2013. The revenue sharing agreement became effective as of 1 April 2014 Code The Dutch Corporate Governance Code Dutch Financial Supervision Act The Dutch Financial Supervision Act (Wet op het Financieel Toezicht) and the rules promulgated thereunder EBITDA Operating Profit Before Exceptional Items and Depreciation and Amortisation ECB European Central Bank EEA European Economic Area EGB European Government Bonds ELITE Business support and capital raising platform for ambitious and fast growing companies created by Borsa Italiana EMEA Europe, Middle East and Africa EMIR The EU Regulation on OTC derivative transactions, central counterparties and trade repositories (Regulation 648/2012) ESG Environmental, Social and Governance ESMA European Securities and Markets Authority ETF or ETFs Exchange traded funds ETPs Exchange traded products EU European Union EU Market Abuse Rules The EU Market Abuse Regulation 596/2014/EU, providing for specific rules that intend to prevent market abuse, such as the prohibitions on insider trading, divulging inside information and tipping, and market manipulation €, Euro The lawful currency of the Member states of the European Union that have adopted it Euroclear Euroclear Bank S.A./N.V. Euronext Euronext N.V. and its consolidated subsidiaries, unless otherwise indicated Euronext Amsterdam Euronext Amsterdam N.V. and/or the Regulated Market of the Company in Amsterdam Euronext Brussels Euronext Brussels S.A./N.V. and/or the Regulated Market of the Company in Brussels Euronext Clearing Euronext’s multi-asset clearing house, formerly known as CC&G Euronext College of Regulators The parties to a Memorandum of Understanding between the competent authorities regarding the co-ordinated regulation and supervision of Euronext being the AMF, the AFM, the CBI, the FSA, the FSMA, CMVM, and CONSOB Euronext Dublin Irish Stock Exchange Plc and/or the Regulated Market of the Company in Dublin Euronext Lisbon Euronext Lisba-Sociedade Gestora de Mercados Regulamentados and/or the Regulated Market of the Company in Lisbon market operator The operator of a regulated market Euronext Market Subsidiary or Subsidiaries (A) each and any of (1) Euronext Paris S.A., (2) Euronext Amsterdam N.V., (3) Euronext Brussels S.A./N.V., (4) Euronext Lisbon S.A., (5) Euronext London Ltd and (6) any other Subsidiary of the Company operating a Regulated Market, and (B) any other Subsidiary that is subject to regulatory supervision controlled, directly or indirectly, by any of the entities listed in sub-paragraph (A), including without limitation Interbolsa S.A. Euronext Paris Euronext Paris S.A. and/or the Regulated Market of the Company in Paris Euronext Rulebooks The Euronext Rulebook containing the rules applicable to the Euronext Market Operators (Rulebook I) and the various non-harmonised Euronext Rulebooks containing local exchange-specific rules (Rulebook II) Euronext Securities The CSD network connecting European economies to global capital markets Exchange Licence (A) each declaration of no-objection or approval granted by or on behalf of the College of European Regulators to the Company in relation to the operation or holding of one or more Regulated Markets and/or the operation of one or more Multilateral Trading Facilities by the Company or any of the Euronext Market Subsidiaries, (B) each licence granted by or on behalf of the Minister of Finance of the Netherlands to the Company in relation to the operation or holding of one or more Regulated Markets, as well as (C) each declaration of no-objection granted by or on behalf of the Minister of Finance of the Netherlands to any person holding a qualifying participation in the Company and/or any of its Euronext Market Subsidiaries in the Netherlands within the meaning of section 1 of the Act, in each case such licence, approval or declaration of no-objection (i) as granted pursuant to the Act or other applicable law implementing Directive 2004/39/EC or the relevant memorandum of understanding constituting the College of European Regulators and (ii) as in force and as amended at the relevant time Facilities Agreement The Facilities Agreement relates to a term loan facilities and a revolving loan facilities entered into between Euronext N.V. and Bank syndicates FCA The UK Financial Conduct Authority FCPE Fonds Commun de Placement d’Entreprise “Euronext group” FICC Fixed Income, Currencies and Commodities Finanstilsynet Financial Supervisory Authority of Norway FinTech or fintech Abbreviation for Financial Technology FRSA The Dutch Financial Reporting Supervision Act (Wet toezicht financiële verslaggeving) FSMA Belgian Authority for the Financial Markets (Financial Services and Markets Authority) FTEs Full-time employee equivalents General Meeting The general meeting of shareholders (algemene vergadering van aandeelhouders) of Euronext N.V. GHG Greenhouse gas GOA The further amended and restated governance and option agreement, to which ICE, the stichting and the Company are parties Group The Company and its consolidated subsidiaries ICE Intercontinental Exchange, Inc. (formerly named Intercontinental Exchange Group, Inc.), together with its consolidated subsidiaries IFRS International Financial Reporting Standards as adopted by the European Union IOI Indication of interest IPO Initial public offering IT Information technology Interbolsa The CSD in Portugal for the Portuguese market JV SPV Joint Venture Special Purpose Vehicle LCH SA Banque Centrale de Compensation, trading as LCH SA LCH SA Agreements The Cash Clearing Agreement and the Derivatives Clearing Agreement LIFFE LIFFE Administration and Management Lit trading venue Trading venue displaying bid and offer prices at any time LTI Long Term Incentive LSEG London Stock Exchange Group plc, MAD The EU Market Abuse Directive (2003/6/EC), now superseded by MAR Managing Board The Managing Board (bestuur) of Euronext N.V. MAR EU Regulation on insider dealing and market manipulation (published on the Official Journal of the European Union on 16 April 2014) which replaces MAD since its entry into force on 3 July 2016 MiFID I The EU Markets in Financial Instruments Directive (2004/39/EC) MiFID II The revised EU Directive on MiFID (published on the Officiel Journal of the European Union on 12 June 2014) MiFID II / MiFIR legislation MiFID II and MiFIR MiFIR EU Regulation on Markets in Financial Instruments (published on the Official Journal of the European Union on 12 June 2014) Monte Titoli Italian central securities depository owned by Euronext since 29 April 2021 MTFs Multilateral trading facilities designated under MiFID and MiFID II MTS Bondvision MTS BondVision is a regulated and secure multi-dealer-to-client trading platform for government bonds and credit MTS One of Europe’s leading electronic fixed income trading markets NGEU Next Generation EU, recovery plan for Europe: https://ec.europa.eu/info/strategy/recovery-plan-europe_en NOTC Norwegian OTC-list, a market place for unlisted shares NTI Net Treasury Income NYSE Euronext The Parent through 13 November 2013 Offering The offering of Ordinary Shares as that took place on 20 June 2014 Optiq® Euronext new enhanced multi-market proprietary trading platform Ordinary Shares Issued and outstanding ordinary shares in the share capital of the Company OTC Over-the-counter Parent NYSE Euronext, through 13 November 2013, and ICE, from 13 November 2013 until 20 June 2014 Priority Share Priority share in the share capital of the Company Prospectus Directive Directive 2003/71/EC of the European Union, and any amendments thereto, including Directive 2010/73/EU Qualifying Participation Direct or indirect interest of 10% or more of the share capital or voting rights Quantitative Easing Quantitative easing is a monetary policy in which a central bank purchases government securities or other securities from the market in order to lower interest rates and increase the money supply Reference Shareholders A group of institutional investors comprised of Novo Banco., an affiliate of Banco Espírito Santo, S.A., BNP Paribas S.A., BNP Paribas Fortis S.A./N.V., ABN AMRO Bank N.V. through its subsidiary ABN AMRO Participaties Fund I B.V., ASR Levensverzekering N.V. (a company of the ASR Nederland group), Caisse des Dépôts et Consignations, Bpifrance Participations, Euroclear S.A./N.V., Société Fédérale de Participations et d’Investissement/Federale Participatie- en Investeringsmaatschappij, Société Générale and BancoBPI Pension Fund represented by BPI Vida e Pensões - Companhia de Seguros, S.A. Reference Shareholders Agreement The agreement entered into by the Reference Shareholders dated 3 June 2014 Regulated Market A multi-lateral system or trading venue designated to be a “regulated market” under MiFID and MiFID II RFQ Request for quotation RIE Recognised investment exchange ROCE Return on capital employed SaaS Software as a service Science-Based Targets The Science-Based Targets initiative : https://sciencebasedtargets.org/business-ambition-for-1-5c Selling Shareholder ICE Europe Parent Ltd Separation Establishment of Euronext as an independent, publicly traded company by means of an initial public offering SFTI® Secure Financial Transactions Infrastructure Shareholder Any shareholder of the Company at any time Share Purchase Agreement The sale and purchase agreement of Ordinary Shares in Euronext N.V. entered into between ICE, the Selling Shareholder and the Reference Shareholders dated 27 May 2014 Single Order Book Single Order Book for Euronext Paris, Euronext Amsterdam, and Euronext Brussels which unites trading, clearing and settlement across the exchanges in France, Belgium, and the Netherlands, which results in one single trading line for all listed securities, including those listed currently on more than one Euronext markets for which the Single Order Book executes trades on the designated market of reference. SLAs Transitional services agreements and related agreements SMEs Small and medium-sized enterprises SPAC Special purpose acquisition company SRI Socially Responsible Investing refers to investment strategies that seek to maximise financial return while maximising social good and minimising environmental footprint Subsidiary Has the meaning as referred to in section 2: 24a of the Dutch Civil Code Supervisory Board The Supervisory Board of Euronext N.V. Support Items Related support items to the Core Items Tech or tech abbreviation for technology TMT Technology, media and telecom Transparency Directive The EU Transparency Directive 2004/109/EC, as amended by Directive 2013/50/EU with respect to transparency and disclosure obligations T2S TARGET2-Securities, the European technical platform set up and operated by the Eurosystem that allow core, neutral and borderless settlement of securities transactions on a DvP (delivery-versus-payment) basis in Central Bank Money UN United Nations UTP or Euronext UTP Universal Trading Platform or Euronext Universal Trading Platform WACC Weighted average cost of capital Reference table in accordance with Annex 1 Regulation (EU) 2017/1129 1 PERSONS RESPONSIBLE, THIRD PARTY INFORMATION, EXPERTS’ REPORTS AND COMPETENT AUTHORITY 1, 137-138 2 STATUTORY AUDITORS 191 3 RISK FACTORS 59-69 4 INFORMATION ABOUT THE ISSUER 184 5 BUSINESS OVERVIEW 5.1 Principal activities 29-48, 199-201 5.2 Principal markets 206-216 5.3 The important events in the development of the issuer’s business. 20, 202-206 5.4 Strategy and objectives 21-22, 24-29 5.5 Patents or licences, industrial, commercial or financial contracts or new manufacturing processes n/a 5.6 Basis for statements on competitive position 23-24, 29-33 5.7 Investments 219-221 6 ORGANISATIONAL STRUCTURE 6.1 Organisational structure 20-22 6.2 Significant subsidiaries 257-258 7 OPERATING AND FINANCIAL REVIEW 7.1 Financial condition 7.1.1 Financial review and analysis 207-216 7.1.2 Future development and R&D 24-29 7.2 Operating results 202-206, 206-216 8 CAPITAL RESOURCES 8.1 Capital resources 218-222, 232-234 8.2 Cash flows 218-221 8.3 Borrowing requirements and funding structure 219-221 8.4 Restrictions on the use of capital resources 243-244 8.5 Anticipated sources of funds needed to fulfil commitments 231-234 9 REGULATORY ENVIRONMENT 48-54 10 TREND INFORMATION 10.1 Recent trends and significant change in the performance 205-207 10.2 Information trends or events that could have material impact 205-207 11 PROFIT FORECASTS OR ESTIMATES n/a 12 ADMINISTRATIVE, MANAGEMENT AND SUPERVISORY BODIES AND SENIOR MANAGEMENT 137-151, 169-170, 186-190 13 REMUNERATION AND BENEFITS 155-171 14 BOARD PRACTICES 14.1 Board members current term of office 138-151 14.2 Management and supervisory bodies’ service contracts providing for benefits upon termination of employment 167 14.3 Audit committee and remuneration committee 142-143, 153 14.4 Compliance with the corporate governance regime applicable 136-137 14.5 Potential material impacts on the corporate governance, including future changes in the board and committee composition 138-151 15 EMPLOYEES 15.1 Number of employees and breakdown 105-112, 130 15.2 Shareholdings and stock options 315-319 15.3 Arrangements involving the employees in the capital 105-108, 162-166 16 MAJOR SHAREHOLDERS 184-190 17 RELATED PARTY TRANSACTIONS 229-231 18 FINANCIAL INFORMATION CONCERNING ASSETS AND LIABILITIES, FINANCIAL POSITION AND PROFITS AND LOSSES 18.1 Historical financial information 18.1.1 Audited historical financial information covering the latest three financial years 174-177 18.1.2 Change of accounting reference date n/a 18.1.3 Accounting standards 226 18.1.4 Change of accounting framework n/a 18.1.5 National accounting standards n/a 18.1.6 Consolidated financial statements 238-321 18.1.7 Age of financial information 305 18.2 Interim and other financial information n/a 18.3 Auditing of historical annual financial information 322-329 18.4 Pro forma financial information n/a 18.5 Dividend policy 193-194 18.6 Legal and arbitration proceedings 231 18.7 Significant change in the issuer’s financial position 206-207, 303 19 ADDITIONAL INFORMATION 19.1 Share capital 184-190 19.2 Memorandum and Articles of Association 184-190, 190-192 20 MATERIAL CONTRACTS 229-231 21 DOCUMENTS AVAILABLE 137-138 Reference table in accordance with Annex 2 Regulation (EU) 2017/1129 1 Disclosure requirements for the registration document for equity securities laid down in Annex 1 335-337 1.2 Statement that the URD may be used for the purposes of an offer to the public of securities or admission of securities to trading on a regulated market if completed by amendments, if applicable, and a securities note and summary approved in accordance with Regulation (EU) 2017/1129 1